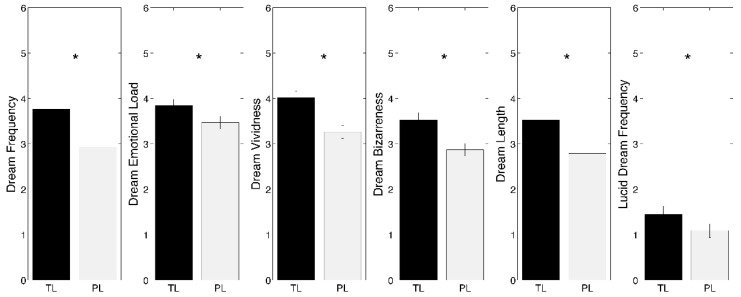
Figure 1.
Results of the comparisons (paired t-tests) between total lockdown (TL, black bars) and post-lockdown (PL, gray bars), performed on quantitative and qualitative dream variables. Each box represents a dream feature. Error bars represent the standard errors. Asterisks index significant differences (p < 0.05).

