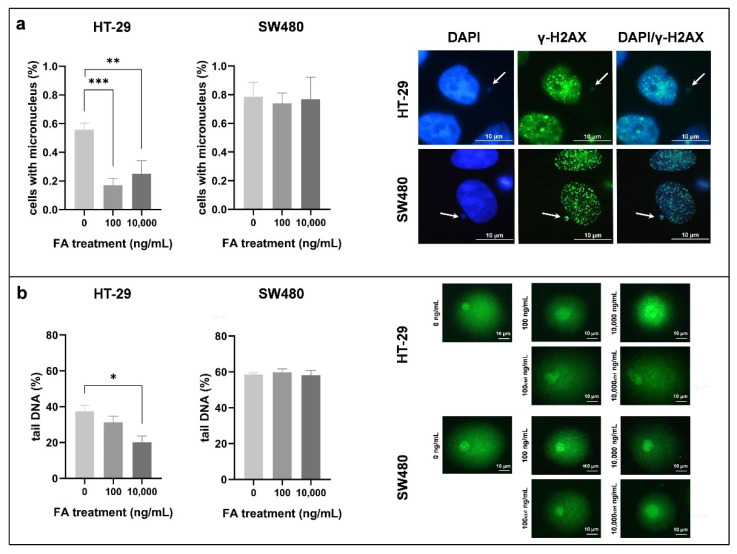
Figure 2.
Genomic stability detection of HT-29 and SW480 cells exposed to different folic acid (FA) concentrations (0, 100, 10,000 ng/mL). (a) Micronucleus (MN) scoring was performed on DAPI- and anti-γ-H2AX-stained slides. Left: We obtained the results by proportioning the cells with MN with all cells counted (** p ≤ 0.01, *** p ≤ 0.001). Right: Representative γ-H2AX-positive micronuclei are indicated with arrows. (b) DNA integrity was evaluated with comet assay, additionally. Left: Graphs show the changes in genomic stability in consideration of comet tail DNA percentage (* p ≤ 0.05). Right: Characteristic comets of both cell lines were captured following different treatments. FA: folic acid.

