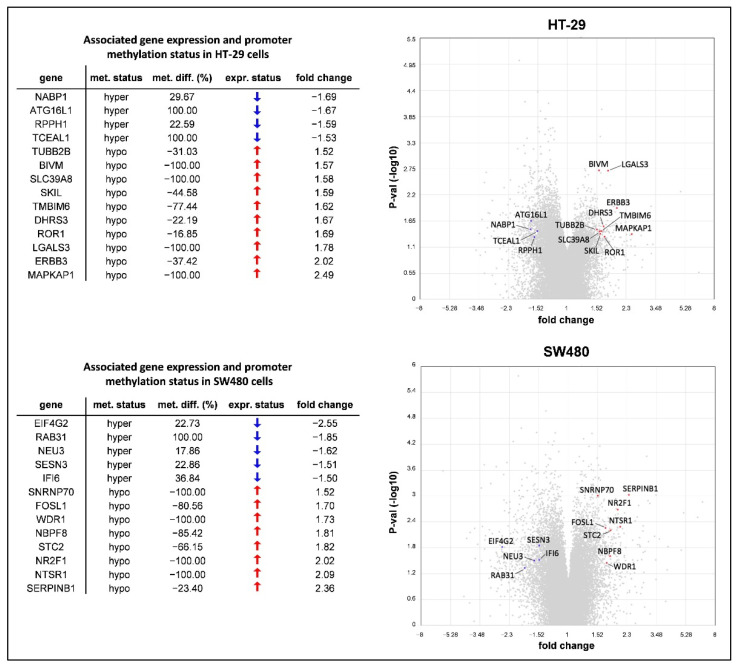
Figure 5.
The intersection of genome-wide DNA methylation and gene expression data obtained by Reduced Representation Bisulfite Sequencing (RRBS) and Human Transcriptome Array (HTA) 2.0 analyses. Values represent the methylome and transcriptome pattern changes of 10,000 ng/mL folic acid (FA)-treated HT-29 and SW480 cells compared to non-treated samples (0 ng/mL FA). Only genes with promoter methylation status alteration in accordance with their expression level (p ≤ 0.05 and fold change ≥|1.5|) were listed (left) and also visualized in volcano plots (right). Gray points represent all the transcripts detected by the microarray, while blue ones highlight down- and red ones show upregulating genes from the list. met. status: DNA methylation status; met. diff.: DNA methylation difference; expr. status: gene expression status; P-val: p-value.

