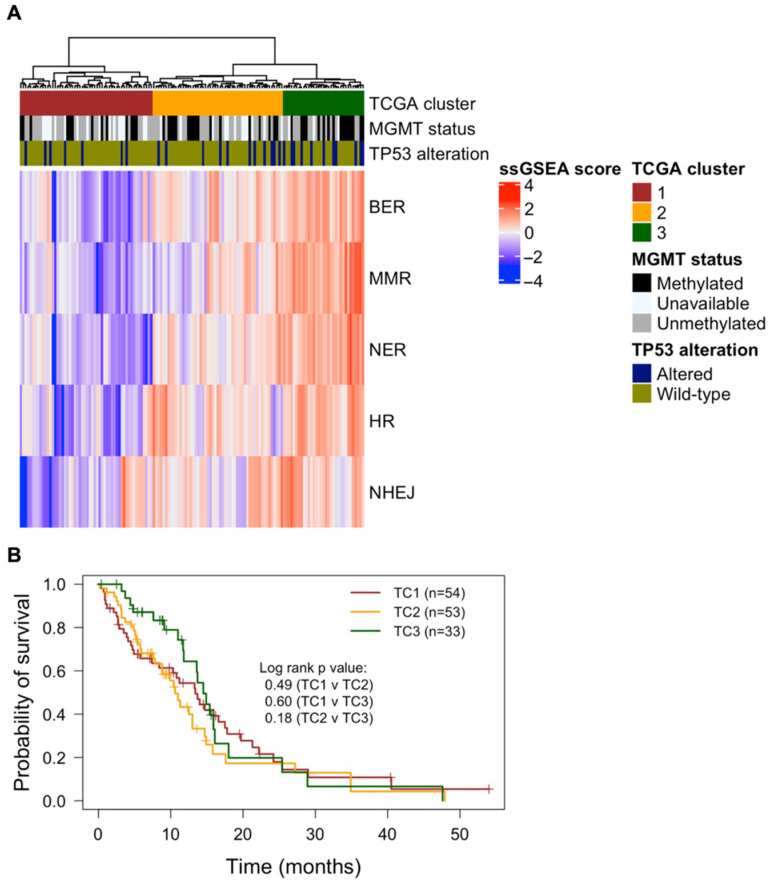
Figure 1.
Transcriptomic profile of DDR pathways of glioblastoma patients in the TCGA cohort (n = 140). (A) Log-transformed ssGSEA scores are represented for each DDR pathway; and after hierarchical clustering (Ward’s method), three distinct TCGA clusters were identified (TC1, TC2, and TC3). The Kruskal–Wallis test was used to compare ssGSEA scores of each pathway between clusters, with the same trend followed across all DDR pathways: TC1 < TC2 < TC3 (p < 0.01). MGMT methylation status and TP53 alterations (SNVs or homozygous deletions) are also depicted for respective patient samples. (B) Kaplan–Meier plots of OS are shown for patients within DDR clusters (TC1—red; TC2—yellow; TC3—green). The log-rank test was performed between each combination of clusters, revealing no significant OS differences between clusters. Statistical significance was determined with a p-value < 0.05.

