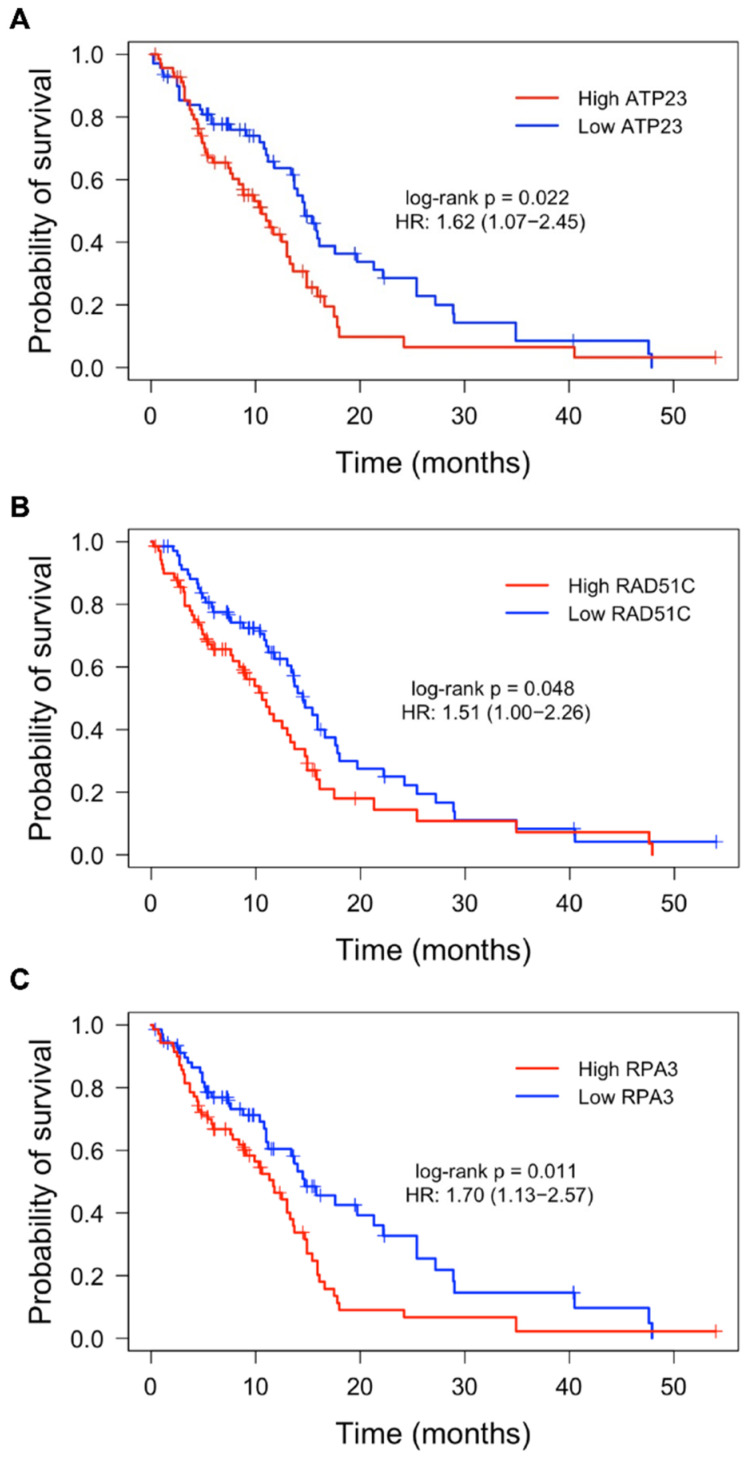
Figure 2.
Kaplan–Meier plots of OS for high and low expression of ATP23, RAD51C and RPA3 in the TCGA glioblastoma cohort. Patients were stratified into “high” (red) and “low” (blue) expression groups based on a median split of RNA expression for each respective DDR gene. Across all samples (n = 140), high expression of ATP23 (A), RAD51C (B) and RPA3 (C) was significantly associated with lower OS. Log-rank p-values and hazard ratio prior to multiple Cox regression are shown. Significance was established in genes with p-value < 0.05 after both a log-rank test and multiple Cox regression of significant clinical features (i.e., therapy).

