Figure 3.
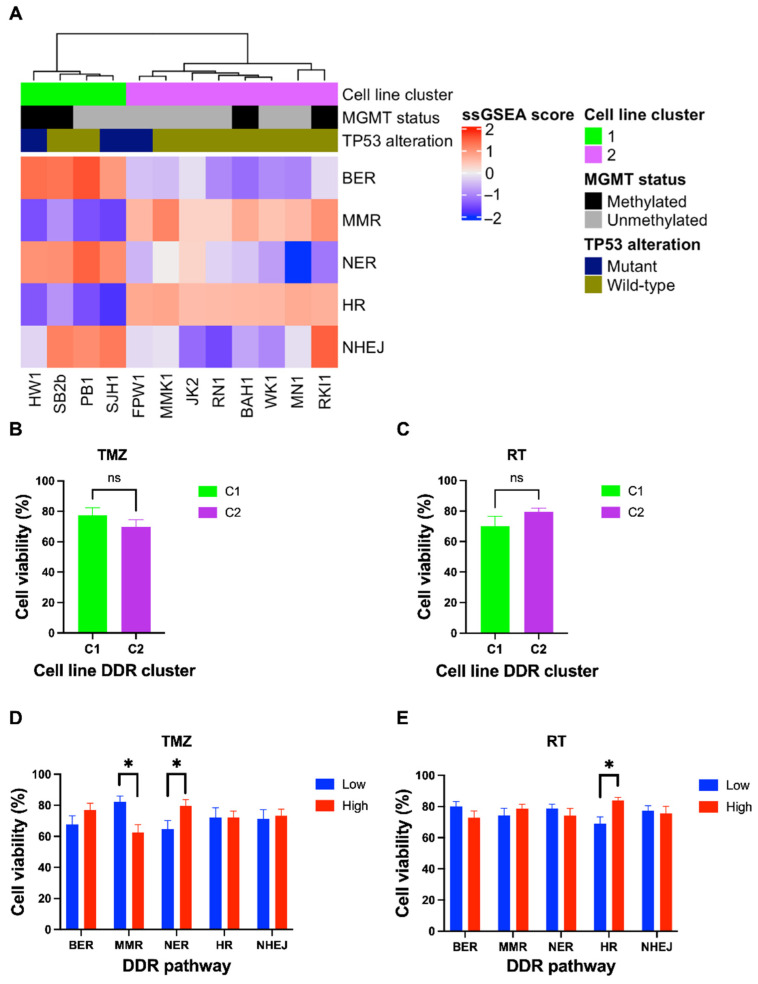
Transcriptomic profiling of DDR pathways in 12 patient-derived glioblastoma cell lines and response to standard treatment. (A) Log-transformed ssGSEA z-scores are shown corresponding to relevant DDR pathways, including MGMT methylation status and TP53 mutation of glioblastoma cell lines. Two distinct clusters were identified (C1 and C2), in which C1 had a significant upregulation of BER and NER pathways (p = 0.004), while MMR and HR were upregulated in C2 (p = 0.004). Cell lines were treated with a clinically relevant dose of TMZ (35 µM) or RT (2 Gy) for 7 days, cell viability assessed using MTT assay. Cell lines were grouped and compared using a student’s t-test to assess differences in TMZ and RT response based on DDR cluster (B,C) as well as “high” and “low” expression of DDR pathways (D,E). There was no significant difference in cell viability between the C1 or C2 cell line clusters after TMZ or RT treatment (B,C). TMZ sensitivity was associated with high MMR gene expression, while TMZ resistance was associated with high NER gene expression (D). RT resistance was associated with high HR gene expression (E). p-values < 0.05 were considered significant (* p < 0.05) (ns = non-significant).

