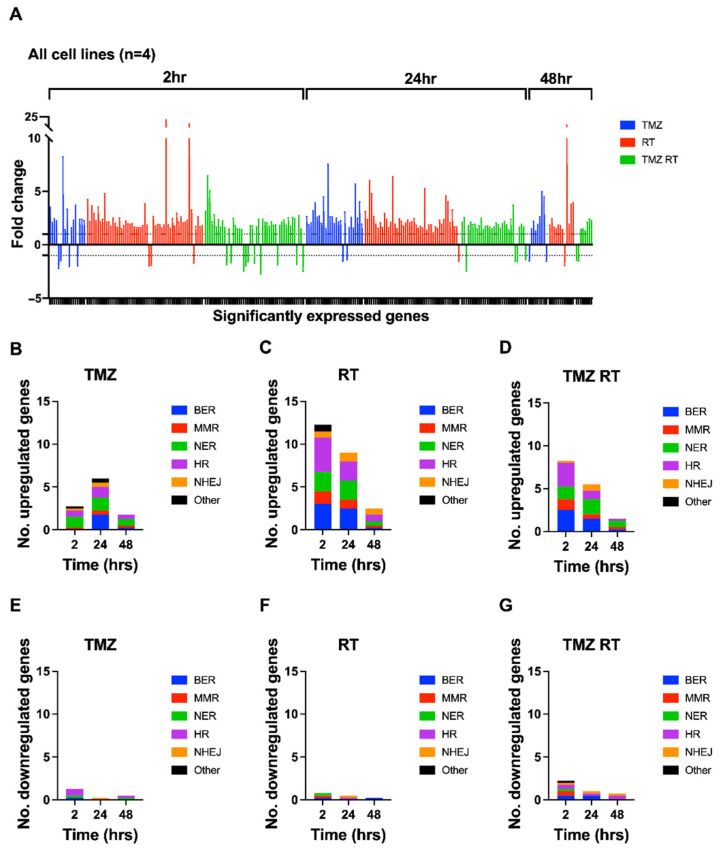
Figure 5.
Accumulated frequency and distribution of DEGs across four patient-derived glioblastoma cell lines (FPW1, HW1, SB2b and MN1) in response to treatment. Cell lines were treated with RT (2Gy) and/or TMZ (35µM) before being harvested for RNA extraction at 2, 24 and 48 h after treatment. Quantitative PCR using a Custom TaqMan array card was undertaken to assess mRNA expression of 84 DDR genes. (A) Fold changes (±SEM) represent the sum total of DEGs across all cell lines, treatments (TMZ- blue; RT—red; TMZ + RT—green), and time points. Positive fold-changes (>1) represent upregulated genes and negative fold-changes (<−1) represent downregulated genes, while the area between 1 and −1 represents baseline expression. To view genes and their fold-changes in order of (A), see Table S5. (B–G) The average numbers of upregulated or downregulated genes across all cell lines for TMZ- (B,E), RT- (C,F) and TMZ + RT- (D,G) treated cells are graphically shown and represent the proportion of pathways that the DDR genes belong to at given time points after treatment. DDR pathways for each gene are depicted in Table S2. BER—blue; MMR—red; NER—green; HR—purple; NHEJ—orange; other—black.

