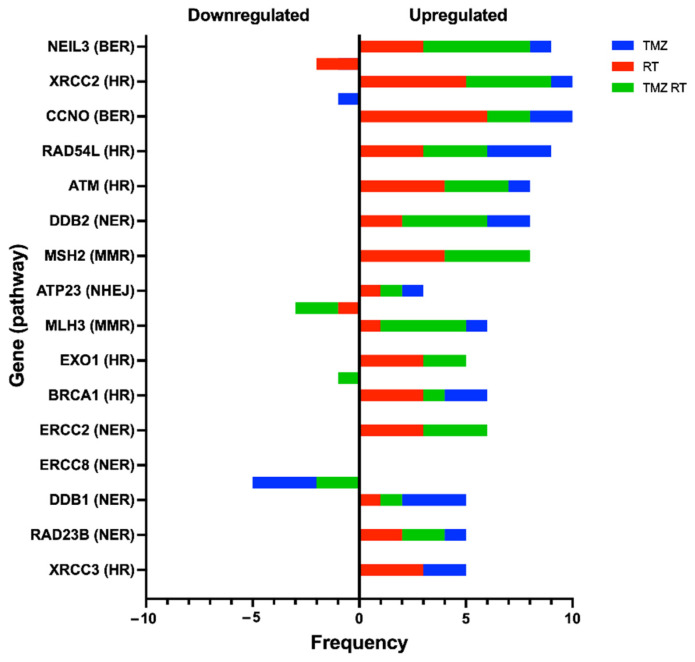
Figure 6.
Top 16 most frequently up- or downregulated genes across all four glioblastoma cell lines (FPW1, HW1, SB2b and MN1). Data include the accumulated frequency across all variables for each respective gene, including the number of upregulated (positive values) or downregulated (negative values) occurrences, and the occurrence of this change in each specific treatment (TMZ = blue, RT = red, TMZ RT = green).

