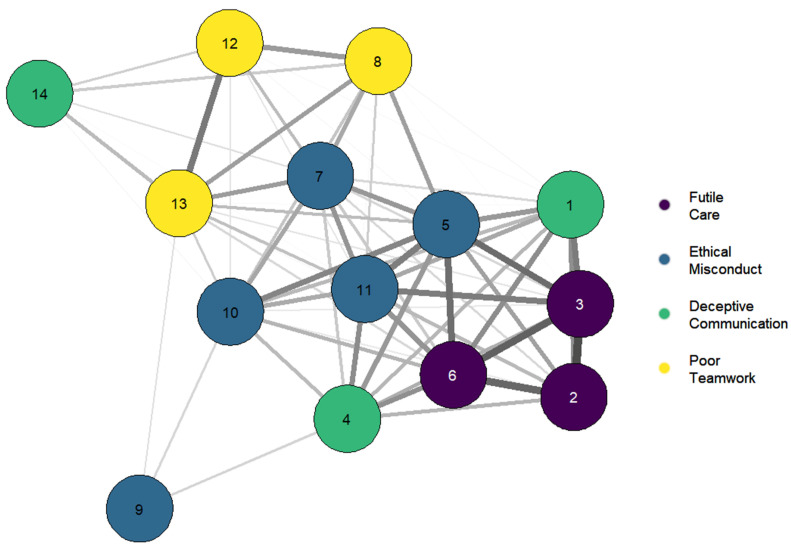
Figure 3.
Network graph of the Italian Pediatric MDS-R factors. Each node represents an item whose color identifies the membership factor. The thickness of the connections is proportional to the size of the Pearson index (all correlations are positive). The bonds corresponding to correlations lower than 0.2 have been obscured to simplify the visualization. The most central nodes of the network correspond to items closely linked with others, while the peripheral nodes correspond to items with scarce and localized links.

