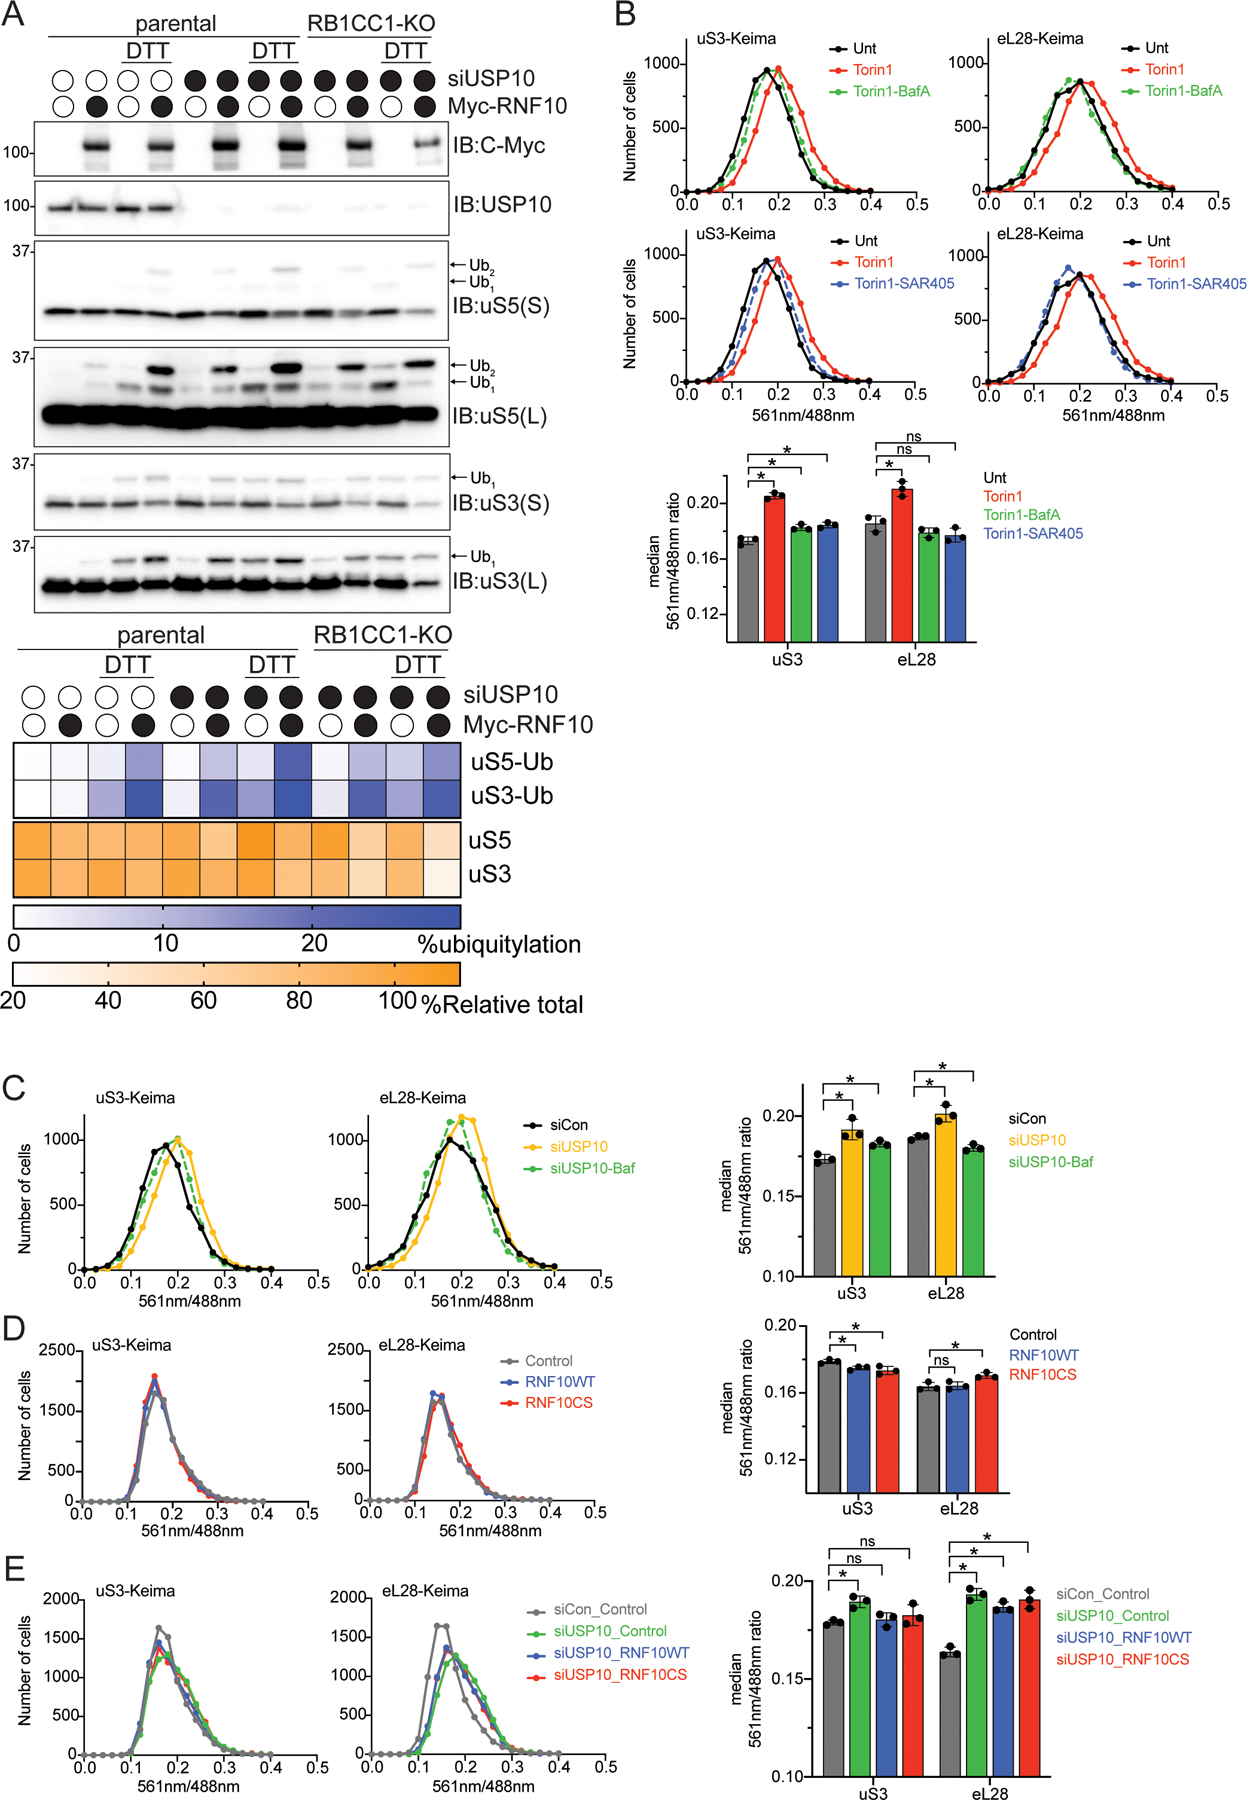
Figure 3. Enhanced ubiquitylation results in turnover of 40S ribosomal proteins in an autophagy-independent manner.

(A) (top) Cell extracts from parental 293T or RB1CC1-KO cells transfected with either a control siRNA oligo or siRNA oligo targeting USP10, followed by transfection with Myc-tagged wild type RNF10 treated as indicated were analyzed by SDS-PAGE and immunoblotted with the indicated antibodies. (bottom) Quantitative representation of percent relative total abundance and uS3 and uS5 percent ubiquitylation.
(B) HEK293 uS3 or eL28 (RPL28) Keima-tagged cells were treated as indicated and frequency distributions of the red (561nm) to green (488nm) ratio are plotted.
(C) HEK293 uS3 or eL28 Keima-tagged cells were transfected with either a control siRNA oligo (black line), siRNA targeting USP10 (yellow line) or in combination with Bafilomycin A (50nM, 1h) treatment (green line). Frequency distributions of the red (561nm) to green (488nm) ratio are plotted.
(D) HEK293 uS3 or eL28 Keima-tagged cells expressing either a control plasmid (grey line), RNF10 wild type (blue line) or the catalytic mutant (red line) 48 hours post transfection were collected and analyzed via FACS. Frequency distributions of the red (561nm) to green (488nm) ratio are plotted.
(E) HEK293 uS3 or eL28 Keima-tagged cells transfected with either a control siRNA oligo (grey line), or siRNA targeting USP10 and expressing either a control plasmid (green line), RNF10 wild type (blue line) or the catalytic mutant (red line) 48 hours post transfection were collected and analyzed via FACS (bottom). All bar graphs denote median red:green ratio from triplicate experiments. N=3, error bars denote SD of triplicate experiments. *=pvalue<0.05, ns = non-significant by unpaired student’s t test.
