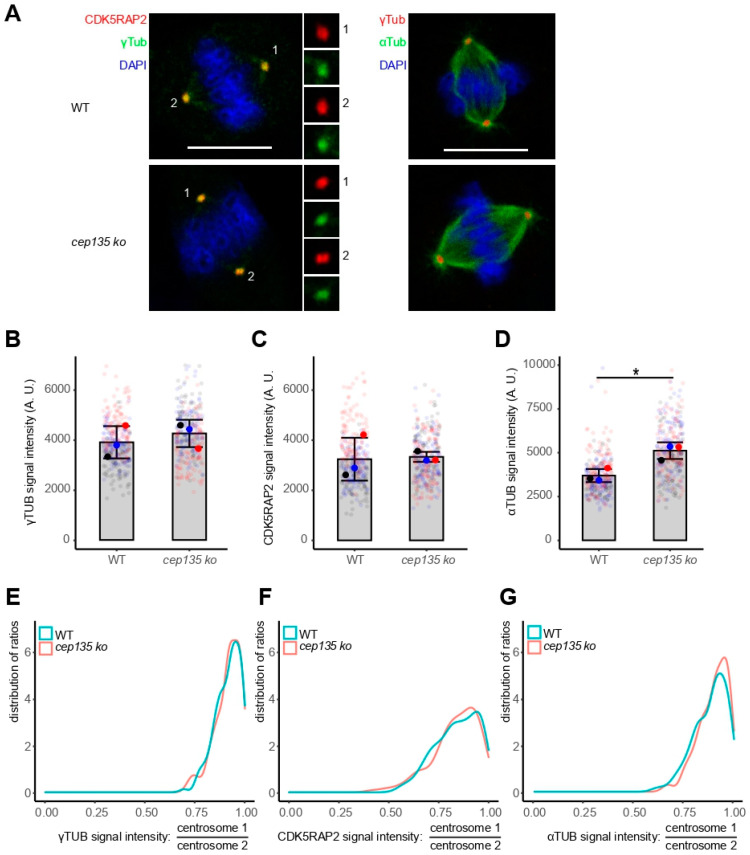
Figure 8.
The two poles of metaphase spindles are balanced in cep135 KO cells. (A) Representative images showing balanced spindle poles in metaphase. Scale bar: 10 µm. (B–D) Signal intensity of metaphase γ-tubulin (B), CDK5RAP2 (C), and α-tubulin (D) signals. A total of 150 cells were measured in total for each cell line. The graph shows mean values ± SD from three independent experiments. The p-value was calculated with a two-tailed Student’s t-test. * indicates p < 0.05. (E–G) The distinct γ-tubulin, CDK5RAP2, and α-tubulin signals of mitotic centrosomes/spindle poles were quantified, and their ratios (higher/lower value) were determined. The plot shows the distribution of ratios ranging from 1 (equal signals) to 0 (extreme asymmetry between the two signals). A total of 150 cells were measured in total for each experimental condition.

