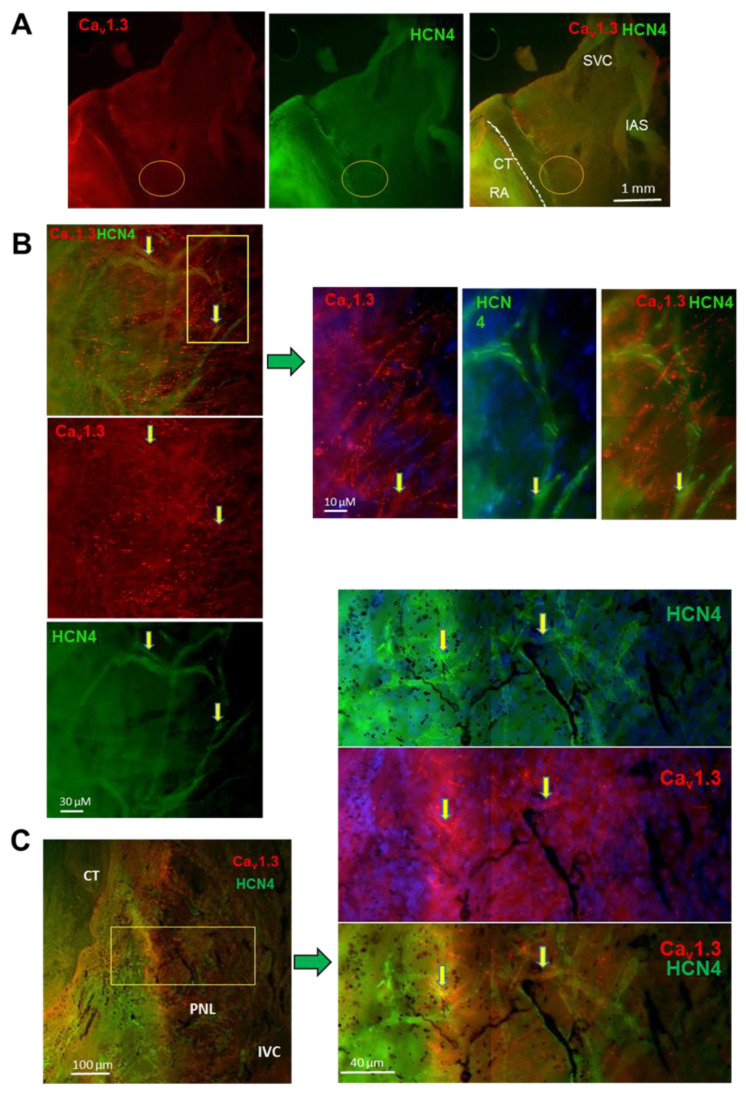
Figure 8.
Co-labeling of Cav1.3 and HCN4 in mouse SAN. (A) Immunolabeling of Cav1.3 (red) and HCN4 (green) in the isolated cranial SAN-RA preparation. (B) Left panels: close-up views of the area circled in (A); right panels: enlargement with cells expressing Cav1.3 or HCN4, from boxed region in left panel. (C) Immunolabeling of regions co-expressing Cav1.3 and HCN4. The left panel shows the region in accordance with the posterior nodal extension (PNL). The yellow rectangle identifies the region considered for close-up views shown in the left panels. Left panels, from top to bottom, indicate corresponding Cav1.3 and HCN4 immunostaining. Yellow arrows indicate SANC co-expressing Cav1.3 and HCN4.

