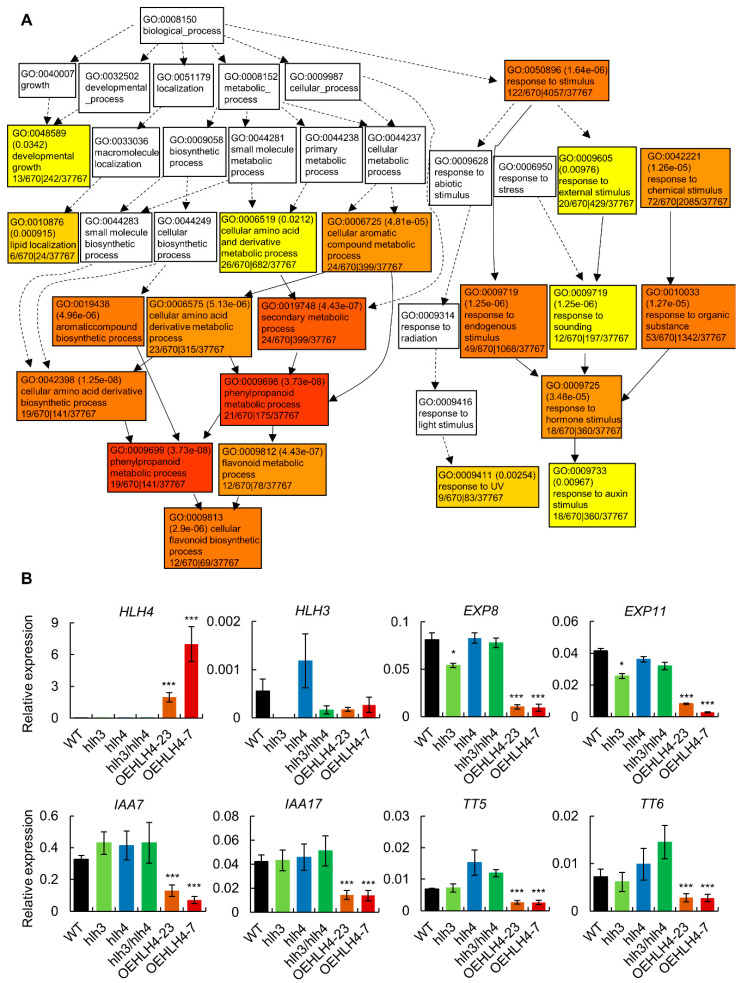
Figure 3.
Transcriptomic analyses of RNA-seq Data and RT-qPCR validation. (A) Gene ontology enrichment analysis of down-regulated DEGs (differentially expressed genes) in O23 leaves. (B) RT-qPCR analysis of selected DEGs. Data represent mean ± SD of three biological replicates with three technical replicates (n = 9). Asterisks indicate significant differences (* p < 0.05, *** p < 0.001).

