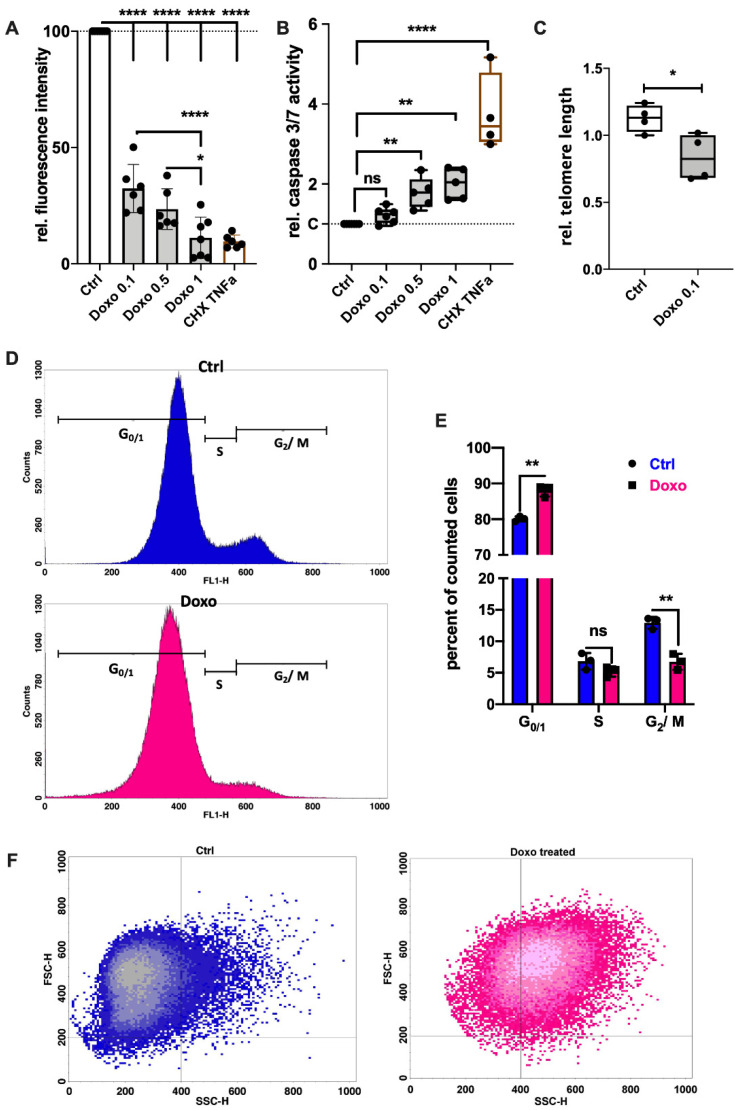
Figure 1.
Influence of Doxo stimulation on the cell cycle and apoptosis of hAC. (A) Fluorescence intensity of the Alamar Blue assay after 7 d of Doxo-stimulation relative to the unstimulated control; TNFa + CHX served as the apoptosis control; n ≥ 6. (B) Relative caspase-3/7 activity after the addition of Doxo at different concentrations or TNF + CHX (apoptosis control); n ≥ 5. (C) Relative telomere length in untreated hAC compared to hAC treated with 0.1 µM Doxo for 7 d. (D) Exemplary histogram of the flow cytometric cell cycle analysis; blue curve = untreated hAC at passage 2; pink curve = hAC at passage 2, treated with 0.1 µM Doxo for 7 d. (E) Corresponding statistics of the cell cycle analysis; n = 3. (F) Exemplary dot plots of the cell size (FSC-H) vs. granularity (SSC-H) of unstimulated (blue) or Doxo-stimulated (pink) hAC, assessed by flow cytometry. Data are presented as scatter plot with bars, mean with standard deviation; or box plots with median, whiskers min to max. Significant differences between groups are depicted as: **** p ≤ 0.0001; ** p ≤ 0.01; * p ≤ 0.05. Statistical analysis: (A,B) one-way ANOVA, Sidak’s multiple comparisons test; (C) paired t-test; (D) multiple t-test. Ctrl = control (unstimulated cells), Doxo = doxorubicin, rel. = relative, ns = not significant.

