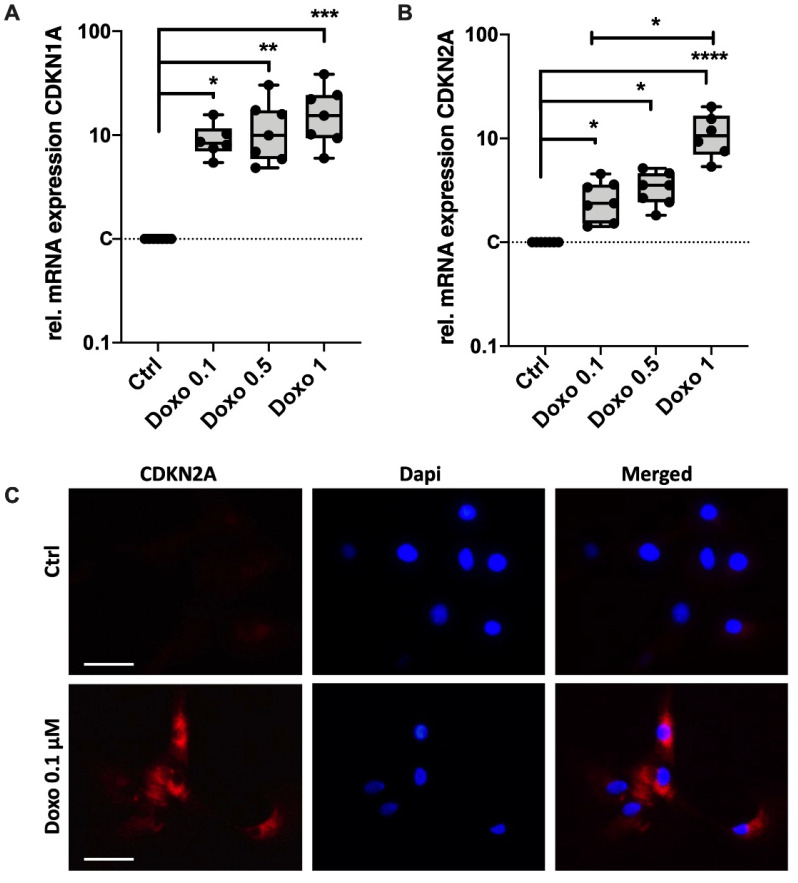
Figure 2.
Effect of Doxo stimulation on the expression of key senescence regulators CDKN1A and CDKN2A. Gene expression analysis of (A) CDKN1A (p21) and (B) CDKN2A (p16) in hAC after 10 d of Doxo stimulation at different concentrations; unstimulated hAC served as controls. (C) Exemplary images of a CDKN2A immunostaining in hAC after stimulation with 0.1 µM Doxo for 7 d. Data are presented as box plots with median, whiskers min to max. Significant differences between groups are depicted as: **** p ≤ 0.0001; *** p ≤ 0.001; ** p ≤ 0.01; * p ≤ 0.05. Statistical analysis: (A,B) One-way ANOVA, Sidak’s multiple comparison. Scale bar = 50 μm. Ctrl = control (unstimulated cells), dapi = 4′,6-diamidino-2-phenylindole.

