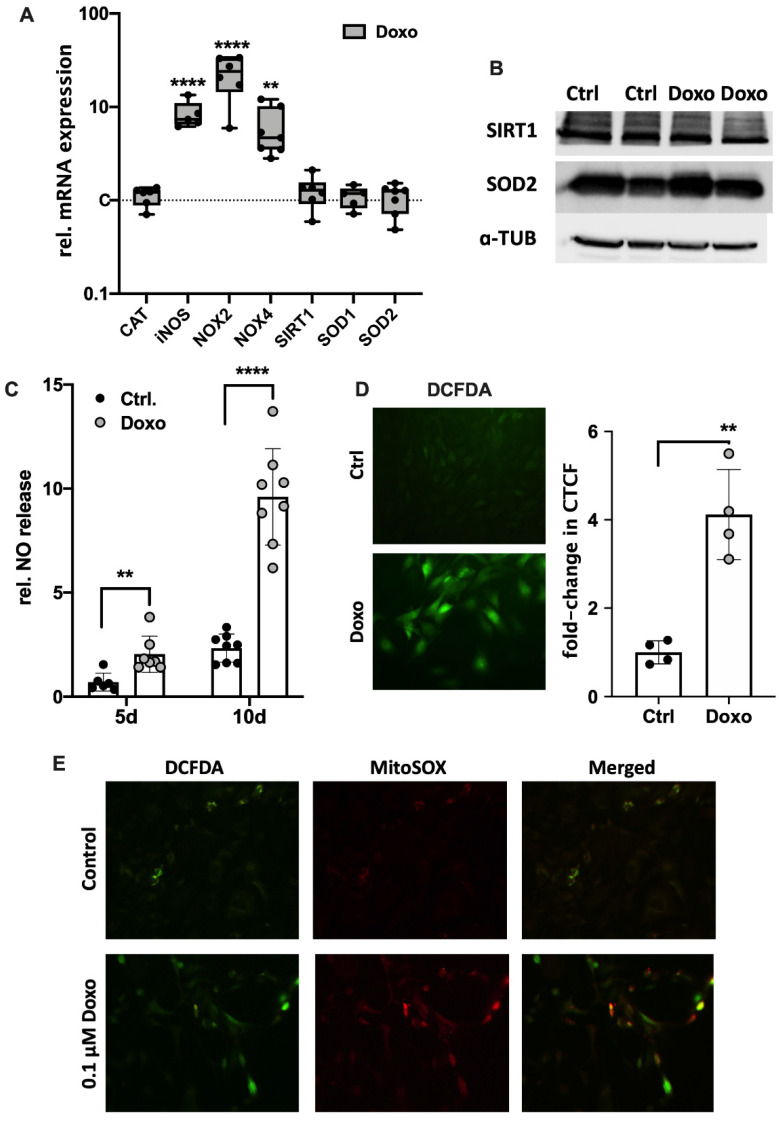
Figure 4.
Effects of Doxo stimulation on oxidative stress markers in hAC. (A) Gene expression of iNOS, NOX2, and NOX4 as well as CAT, SIRT1, SOD1, and SOD2 after Doxo stimulation for 10 d. (B) Exemplary western blot analysis of SIRT1 and SOD2 after Doxo stimulation (n = 2); a-TUB = alpha tubulin. NO release into culture media of Doxo-treated hAC after 5 d and 10 d, respectively. (D) Representative images of DCFDA staining of unstimulated and Doxo-stimulated hAC after 7 d and corresponding quantification of the corrected total cell fluorescence (CTFC). (E) Exemplary co-staining of mitochondrial superoxide (MitoSOX; red) and cytoplasmic ROS (DCFDA; green) of unstimulated (Ctrlol) and Doxo-stimulated hAC after 7 d. Ctrl = unstimulated hAC. Data are presented as scatter plot with bars, mean with standard deviation; or box plots with median, whiskers min to max. Significant differences between groups are depicted as: **** p ≤ 0.0001; ** p ≤ 0.01. Statistical analysis: (A) One-way ANOVA, Sidak’s multiple comparison; (C) multiple t-test; (D) paired t-test. Ctrl = control (unstimulated cells), rel. = relative.

