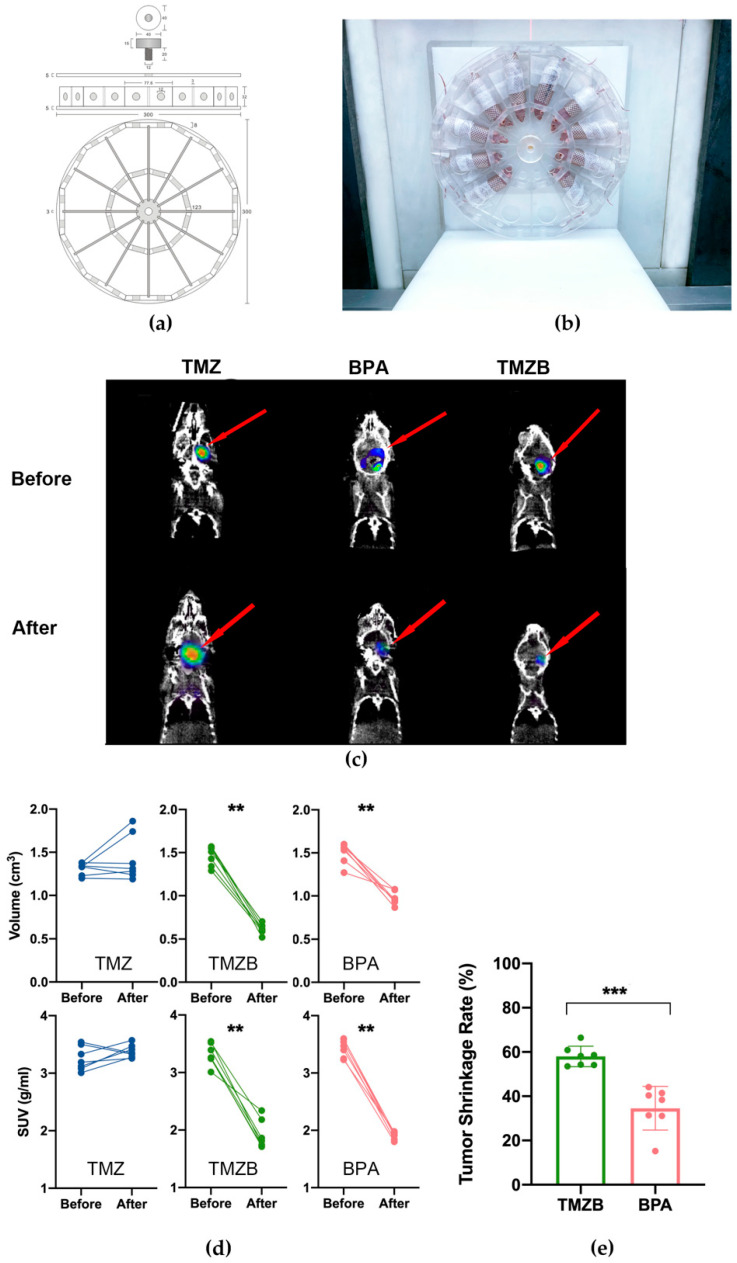
Figure 5.
Evaluation of BNCT response of GBM mouse models via PET/CT imaging. (a) Schematic illustration for the mice immobilization mold. (b) Image of mice in the manufactured device for neutron irradiation in BNCT. (c) Representative PET/CT images before and after BNCT treatment (at 31 days after BNCT treatment). (d) Volume and SUV change in GBM tumors in each mouse before and after BNCT treatments with BPA (50 mg 10B/kg in 5% fructose solution), TMZB solution (50 mg 10B/kg), or TMZ at 600 mg/kg. Certain numbers of mice were tested in each treatment group: nTMZ = 7, nTMZB = 8, nBPA = 8. (e) Tumor shrinkage rate after BNCT with TMZB or BPA. Statistical comparisons were carried out with a Mann–Whitney test and a two-way ANOVA. ** p < 0.01, *** p < 0.001.

