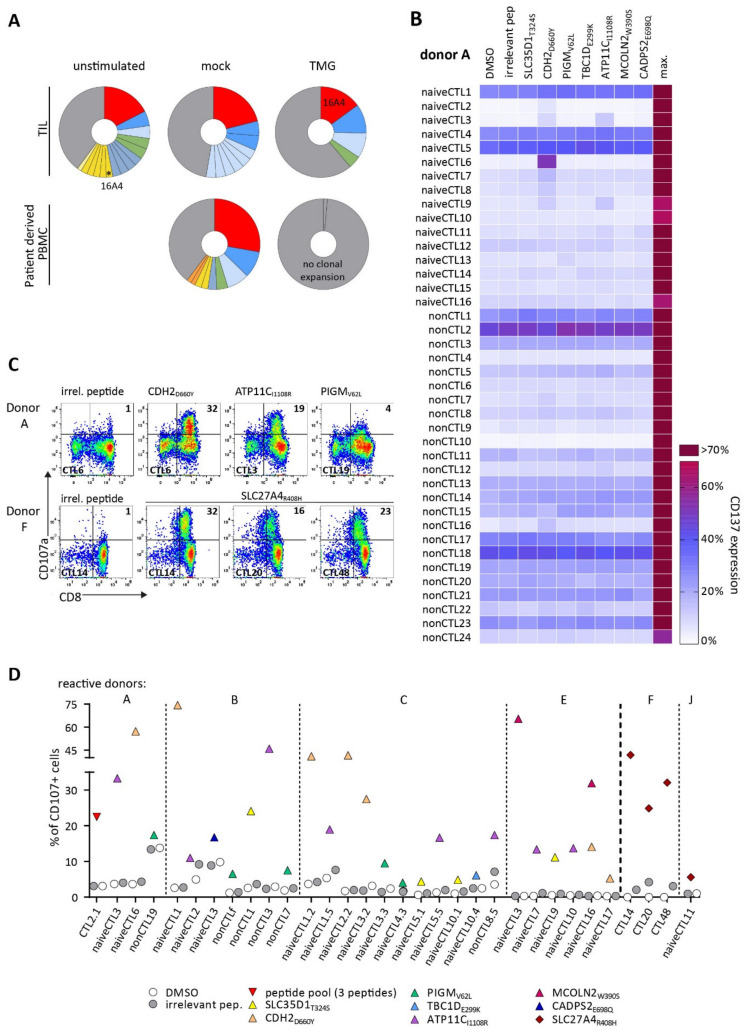
Figure 1.
Stimulation and identification of patient- and donor-derived peptide-reactive T lymphocytes (CTLs). (A) Single-cell sequencing of TILs and PBMCs for patient BIH146. Pie charts show relative frequencies of detected TCRα/β sequences. The most frequent clone in TMG-stimulated TIL is indicated (16A4). Grey segments represent all TCRα/β rearrangements, which were detected only once per sample. (B) Peptide-expanded CTL lines were generated in a peptide stimulation containing all seven neoantigen candidates identified for patient BIH146. Each CTL line was screened for peptide recognition of individually loaded T2 cells, and T cell activation was measured by CD137 surface expression after 20 h. Representative results are shown for donor A-derived CTL lines, which were generated from naive-enriched (naiveCTL) and non-naive (nonCTL) CD8+ T cells. CD137 expression is depicted as a heatmap of the percentage of CD8+ cells. For each patient, five donors were stimulated twice. Max: maximal activation induced by PMA and Ionomycin activation. (C) CTL lines identified by screening assays were stimulated with their specific peptide. T2 cells were pulsed with peptide at 1 × 10⁶ µg/mL and used as target cells in a degranulation assay for 4h in the presence of monensin. Degranulation marker CD107a-positive cells were sorted. Representative FACS plots show CTL lines, which were generated from stimulations of naive and non-naive CD8+ T cells (donor A, upper panel) with a peptide pool of all seven peptides for BIH146 and bulk CD8+ T cells stimulated with one neoantigen candidate for BIH56 (lower panel, donor F). To estimate background activation, T2 cells were loaded with an irrelevant peptide and DMSO control. A representative control is shown (first row). (D) Summary of degranulation assays of all identified CTLs of all reactive donors (n = 6 reactive donors). Alive, single, CD3+CD8+ cells were gated for CD107a expression. Dotted lines separate donors, and the dashed line separates stimulations for patients BIH146 and BIH56.

