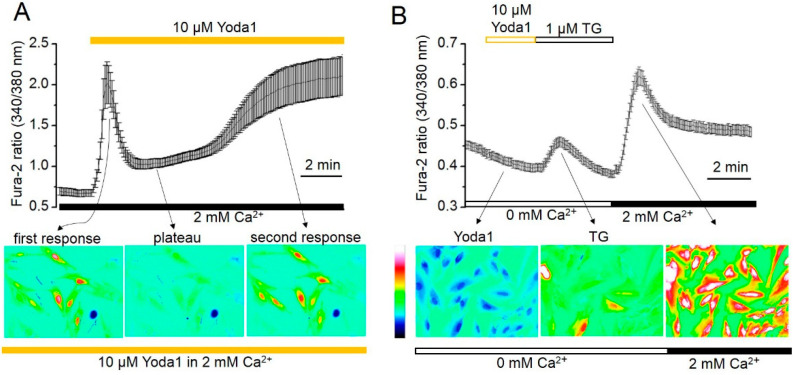
Figure 2.
Yoda1 induces the two-component Ca2+ entry in human eMSCs. (A) Shown are typical Ca2+ responses from the representative experiment (n = 3) following the Yoda1 application to the cells. Measurements were performed in individual cells using the imaging system. [Ca2+]i is plotted versus time. Each point is a mean ± SD from 19 cells. The pseudocolor ratiometric calcium images correspond to the level of [Ca2+]i in the cells at different timepoints after addition of 10 µM Yoda1. (B) Yoda1 induces no Ca2+ increase in Ca2+-free solutions. Shown are typical Ca2+ responses from the representative experiment (n = 3) with Yoda1 addition followed by TG application. Each point is a mean ± SD from 22 cells. The pseudocolor ratiometric calcium images correspond to the level of [Ca2+]i in the cells after the application of 1 µM TG and 2 mM Ca2+.

