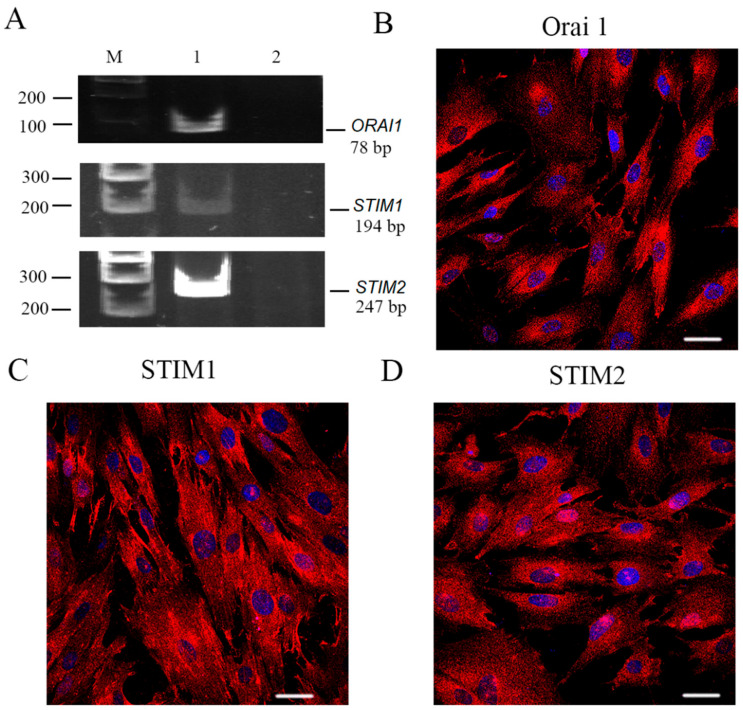
Figure 3.
ORAI1, STIM1 and STIM2 expression in human eMSCs. (A) RT-PCR analysis of ORAI, STIM1 and STIM2 expression in eMSCs. M—size marker. Line 1—primers specific for ORAI1, STIM1 and STIM2 amplified the PCR products of the expected sizes (78, 124 and 247 bp, correspondingly). Line 2—RT-PCR negative control in which reverse transcriptase was omitted. Shown are cropped gels with enhanced contrast. Original gel is shown in Supplementary Figure S5. The distribution of ORAI1 (B), STIM1 (C) and STIM2 (D). Immunoreactivity in eMSCs was examined with confocal microscopy. No staining of the cells was observed after incubation of the cells with only fluorescent secondary antibodies (Supplementary Figure S2). Scale bar is 50 µm.

