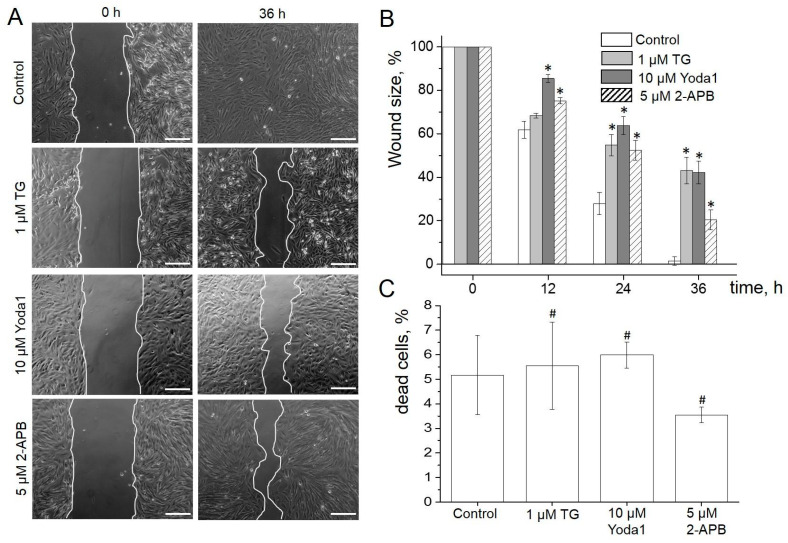
Figure 5.
SOCE and Piezo1 in eMSCs migration. (A) Shown are representative images of the experimental wounds at the beginning (0 h) and the end of the wound healing assay (36 h). The scale bar is 200 µm (B). The eMSC wound healing dynamics in the presence of TG, Yoda1 or 2-APB in the culture media. Wound sizes are shown as mean ± SEM (n = 3–4 for each condition). * significantly different compared to control, Student’s t-test with Welch’s corrections, p < 0.05. (C) No significant changes in the viability of eMSCs were observed. Shown is the mean percent (±SD, n = 3) of dead cells for each experimental condition. #—not significantly different compared to control, two-sample Student’s t-test (p < 0.05).

