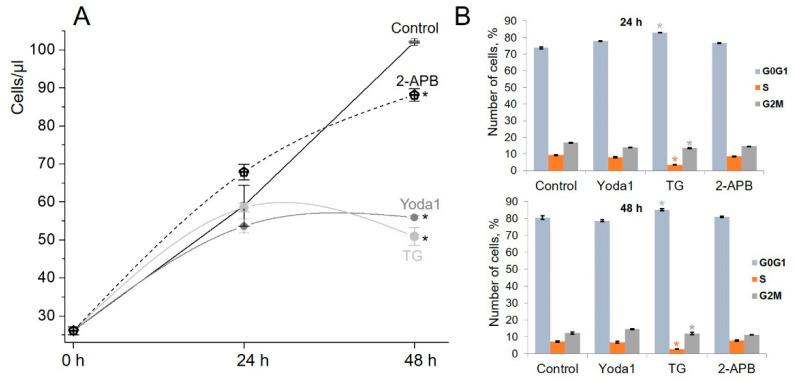
Figure 6.
Impact of Yoda, TG and 2-APB treatment on eMSC proliferation and cell cycle distribution. (A) Growth curves of eMSCs in the presence of 5 µM 2-APB, 10 µM Yoda1 or 1 µM of TG. The data are presented as mean ± SD (n = 3), * significantly different compared to control (Student’s t-test, p < 0.05). (B) The percentage of cells in the G0/G1, S and G2/M phases. The data are presented as mean ± SD (n = 3), * significantly different compared to control (Student’s t-test, p < 0.05).

