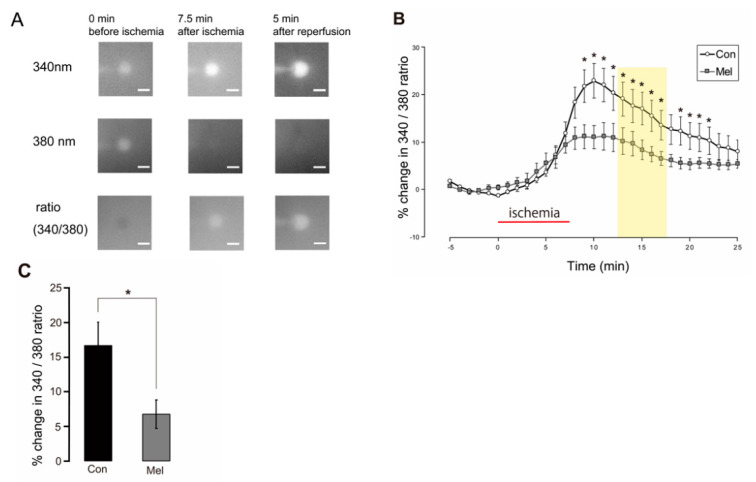
Figure 5.
Effect of melatonin-induced PostC on cytosolic Ca2+ concentration after ischemia-reperfusion. (A) Representative microphotographs showing changes in Fura-2 emissions resulting from excitation at 340 and 380 nm for the control group. The elevation in the Fura-2 ratio (340/380 ratio) represents an increase in cytosolic Ca2+ concentration. Scale bars = 10 µm. (B) Course of changes in the Fura-2 ratio during pre-anoxic, anoxic, and reperfusion periods. Percentages are relative to the mean value observed during the 5 min of the pre-anoxic period. The red horizontal bar indicates the ischemic period. The timeline in the graph is set to 0 min at the start for the ischemic load. The increase in intracellular Ca2+ concentration after reperfusion is significantly inhibited by melatonin-induced PostC (p < 0.05). The yellow band represents the period used for statistical analysis. (C) Each vertical rectangle and error bar indicate percentage change in the Fura-2 ratio during 5–10 min after 7.5 min of ischemia (yellow band in (B)) and SEM, respectively. Asterisks indicate significant difference in t-test (* p < 0.05). Con—control; Mel—melatonin.

