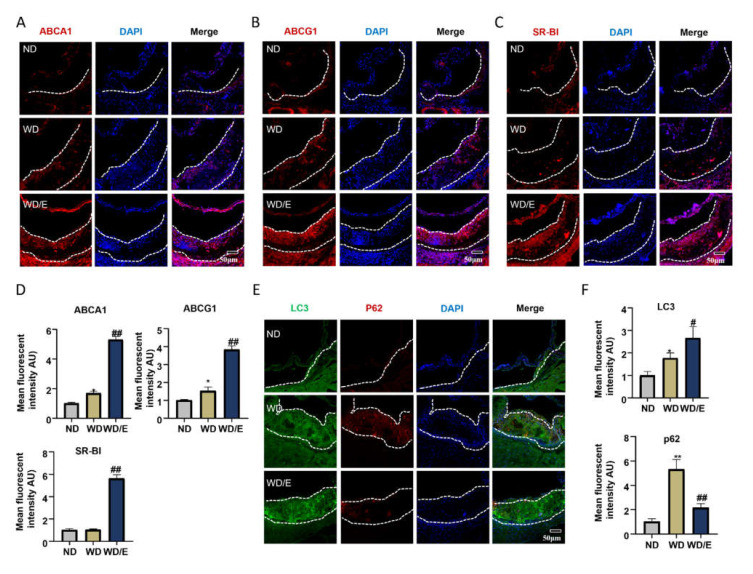
Figure 2.
Exercise increases the protein levels of cellular cholesterol transporters and autophagy flux. (A–C,E) Representative immunofluorescence images of aortic root frozen sections from ApoE−/− mice: (A) ABCA1 stains (red) and DAPI nuclear stains (blue); scale bars, 50 μm. (B) ABCG1 stains (red) and DAPI nuclear stains (blue); scale bars, 50 μm. (C) SR-BI stains (red) and DAPI nuclear stains (blue); scale bars, 50 μm. (E) LC3 stains (green), p62 stains (red), and DAPI nuclear stains (blue); scale bars, 50 μm. (D,F) Quantification of immunofluorescence images (n = 6). Data are represented as means ± SEM. * p < 0.05, ** p < 0.01 vs. ND mice; # p < 0.05, ## p < 0.01 vs. WD mice.

