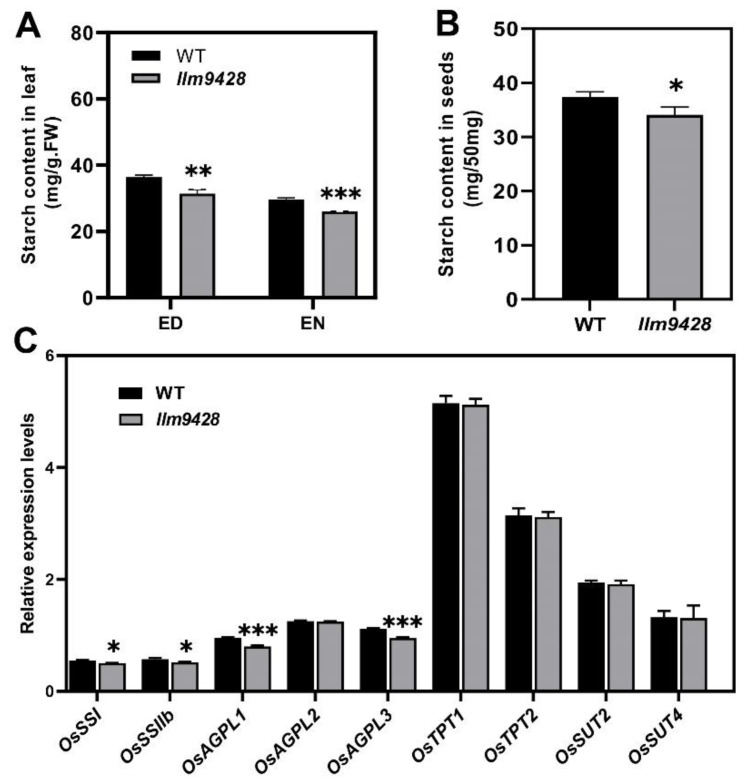
Figure 5.
Comparison of total starch contents and relative expressions of its related genes in WT and llm9428. (A) Comparison of starch contents in the second leaves between WT and llm9428 mutant at tillering stage (ED: end of day, EN: end of night). (B) Comparison of starch contents in mature grains between WT and llm9428. (C) Relative expression levels of starch metabolism-related genes in leaves of WT and llm9428 at heading stage. Statistical analysis was performed using Student’s t-test, *, ** and *** indicate p < 0.05, p < 0.01 and p < 0.001, respectively. Mean and SD were obtained from three individual measurements.

