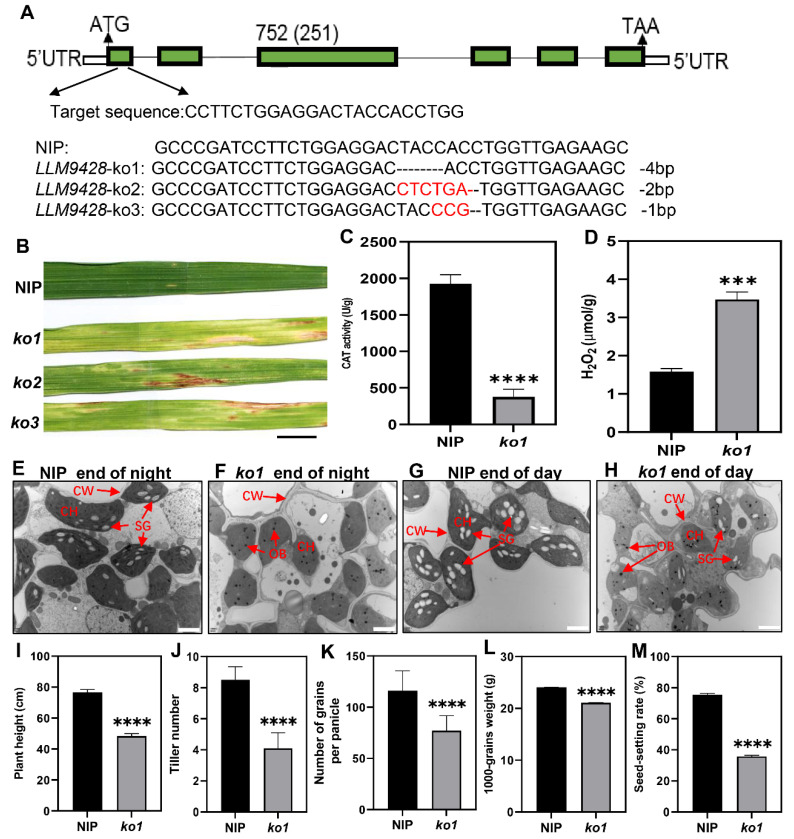
Figure 7.
Phenotypic characterizations of knockout lines. (A) Deletion of nucleotides through CRISPR/cas9 in ko-1, ko2 and ko3, (B) The phenotype of KO lines displaying lesion mimic spots on leaves at tillering stage. NIP: Nipponbare. Scale bar: 1 cm. (C) Changes of CAT activity in the leaf of NIP and ko1 at the tillering stage, (D) Comparison of H2O2 content in the leaves between NIP and ko1 at the tillering stage, (E) Sub-cellular structure of leaves in NIP at the end of the night, (F) Sub-cellular structure of leaves in ko1 at the end of the night, (G) Sub-cellular structure of leaves in NIP at the end of the day, (H) Sub-cellular structure of leaves in ko1 at the end of the day, where CW, cell wall, CH, chloroplast; SG, starch granules; OB, osmiophilic body. Scale bar: 2 μm in (E–H). Comparison of agronomic traits e.g plant height (I), tiller number (J), number of grains per panicle (K), 1000-grains weight (L), and seed setting rate (M). Data were obtained from 10 plants of NIP and ko1. Statistical analysis was performed using Student’s t-test, where *** indicates p < 0.001 in (D) and **** indicates p < 0.0001 in (C,I–M). Data presented in (I–M) were the average of n = 3 plants.

