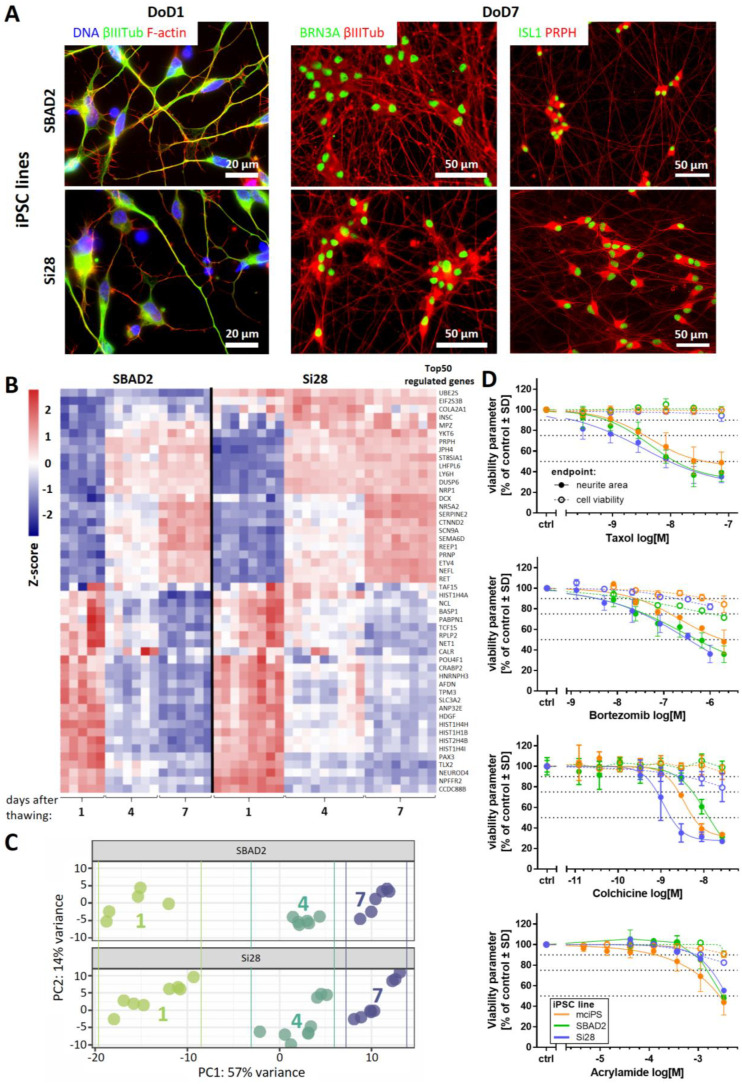
Figure 1.
Reproducible generation of peripheral neurons from different iPSC lines and their use in the PeriTox test. (A) Peripheral neurons derived from the iPSC lines SBAD2 and Si28 were fixed and stained on DoD1 (left) for the neuronal cytoskeletal marker βIII-tubulin (βIIITub, green) and F-actin (red) and on DoD7 (middle, right) for the sensory neuronal transcription factors BRN3A or ISL1 (green) and the cytoskeletal proteins βIIITub or peripherin (PRPH) (red). Color codes and scale bars are given in the images, and the details are shown in Figure S1. DoDx—day of differentiation, counting from thawing of frozen neural precursors on DoD0. (B,C) Whole transcriptome analysis (19,000 genes) was performed for early differentiation states (DoD1, 4, and 7) of SBAD2- and Si28-derived neurons. Data are derived from three independent differentiations (full data in Supplementary File S1). (B) The heatmap depicts the row-wise Z-scores of the top 50 regulated genes (exhibiting the highest variance across all samples). The upper group, as defined by the clustering algorithm, mainly consists of genes upregulated (red) during differentiation and the lower group mainly consists of genes downregulated (blue). (C) For the top 500 variable genes of this data set, a principal component analysis (PCA) was performed. In the two-dimensional PCA display, three differentiation stages are color-coded according to their DoD. Data points and heatmap columns correspond to all technical replicates measured in the 3 experiments per cell line. (D) Peripheral neurons derived from the iPSC lines mciPS (orange), SBAD2 (green) and Si28 (blue) were used in the PeriTox test. The peripheral neurotoxicants taxol, bortezomib, colchicine, and acrylamide were used as positive controls. Effects on the neurite area (solid symbols and lines) and the cell viability (open symbols, dashed lines) are shown. Data are expressed as the mean ± SD of three biological replicates.

