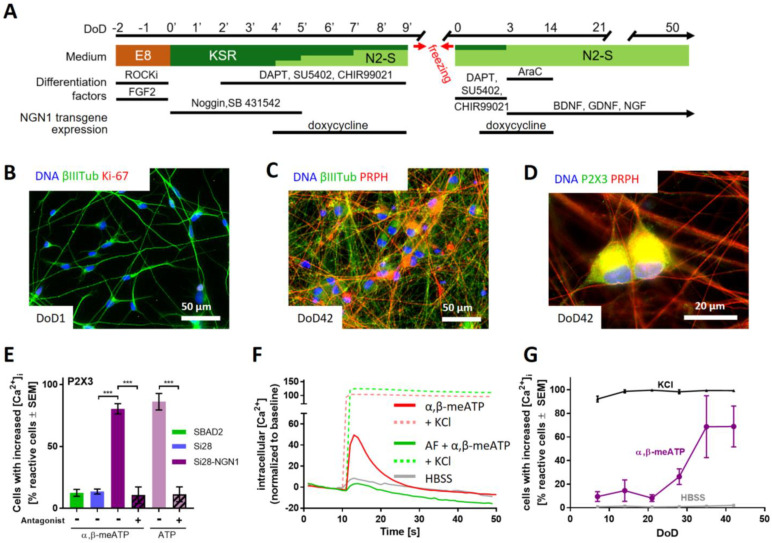
Figure 3.
Sensory neurons exhibiting functional P2X3 receptor signaling. (A) Schematic representation of the differentiation protocol for the generation of functional sensory neurons from the genetically modified iPSC line Si28-NGN1. During the standard differentiation procedure, transient NGN1-transgene expression was induced from DoD4’ until DoD9’ and from DoD1 until DoD14 by addition of doxycycline. DoDx’—day of differentiation, counting from pluripotent state (DoD0’); DoDx—day of differentiation, counting from thawing of frozen neural precursors on DoD0. Other factors added (e.g., ROCKi) are detailed in the methods section. (B–D) Representative immunofluorescence images of cells fixed on DoD1 and stained for (B) βIII-tubulin (βIIITub) and the proliferation marker Ki-67 or on DoD42 and stained for (C) peripherin (PRPH) and βIIITub or (D) P2X3. Nuclei were stained using H33342 (DNA). Color codes and scale bars are given in the images. Details are shown in Figure S5. (E) Peripheral neurons derived from the iPSC lines SBAD2 (green), Si28 (blue), and Si28-NGN1 (purple) were differentiated for >38 days and used for Ca2+ imaging experiments. The P2X3-specific agonist α,β-methylene ATP (α,β-meATP) was used to determine the expression of functional P2X3 receptors. ATP was used as a general agonist for purinergic receptors. AF-353, a P2X3-specific antagonist, was used to confirm exclusive P2X3 expression. (F) Exemplary traces (red) of changes in intracellular Ca2+ concentration ([Ca2+]i) upon α,β-meATP (1 µM) application (solid lines). After the primary stimulus, KCl (dashed lines) was added. Some cells were pre-treated with AF-353 (0.1 µM) (green). The grey line depicts changes upon application of the negative control (HBSS, grey). (G) Time dependency of the expression of functional P2X3 receptors. Sensory neurons were tested weekly for their potential to respond to HBSS, α,β-meATP, and general membrane depolarization induced by KCl. (E,G) Data are expressed as the mean ± SEM of three independent biological replicates. ***, p < 0.0001.

