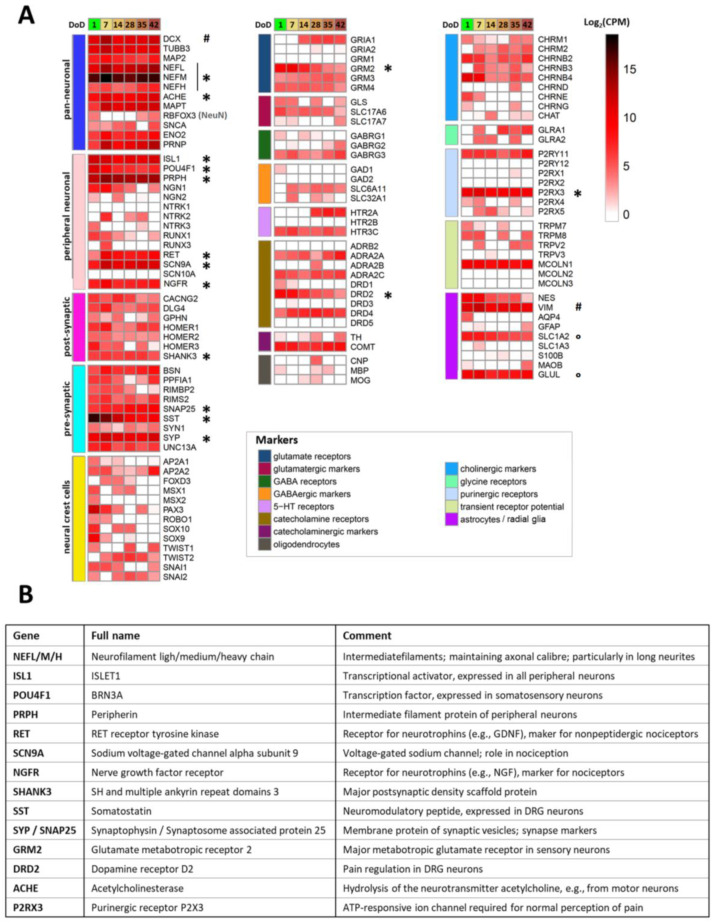
Figure 4.
Transcriptome profiling of Si28-NGN1-derived sensory neurons. Neurons were pre-differentiated to immature sensory neurons and frozen. (A) After thawing, gene expression levels were determined for 6 differentiation stages (on day of differentiation (DoD) 1, 7, 14, 28, 35 and 42) by the TempO-Seq method. The heatmap visualizes the normalized counts for each gene (rows) and the DoD (columns). The neuronal overview panel of 122 genes is clustered by gene groups (e.g., neuronal/glial subtypes, and receptor/ion channel classes). The gene groups are indicated by color bars (left). The absolute expression levels are given in counts of the corresponding gene per 1 million reads (CPM). The color scale uses log2 (CPM) units (see the supplementary files for complete data sets) and ranges from white (no expression) to dark red (high expression). Data are derived from 3 independent differentiations. A subset of genes that that may be used for routine culture controls is highlighted (*). High expression levels of VIM and DCX (#) indicate a still relatively young state of the cells that may be even further matured. SLC1A2 and GLUL (°) are often considered glial markers, but the absence of GFAP, AQP, S100B, and MBP indicate that the cultures do not contain classical astrocytes or Schwann cells. (B) Overview of the highly expressed differentiation markers highlighted in (A) with an asterisk, with their full names and a brief explanation of their biological functions.

