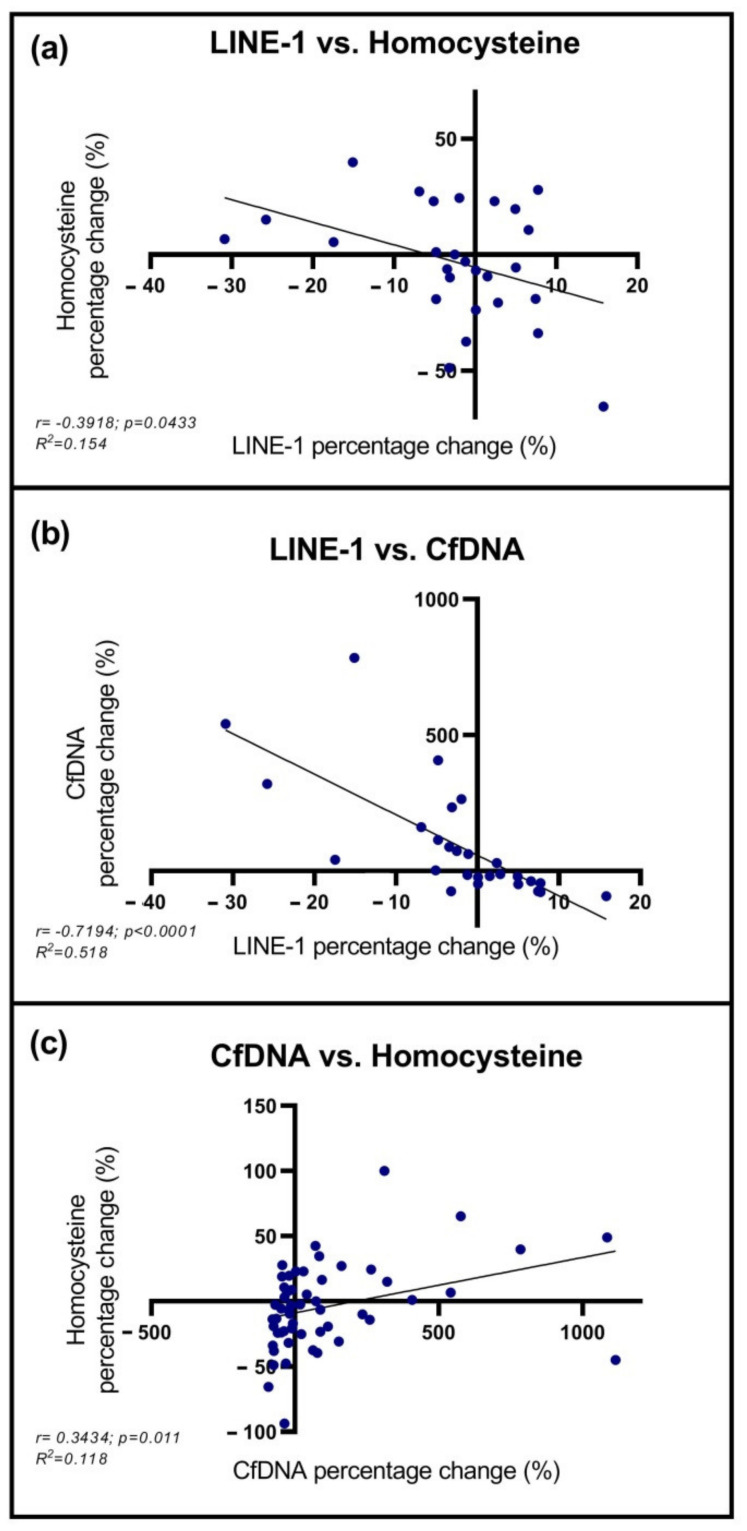
Figure 3.
Correlation analyses of LINE-1 methylation status, homocysteine, and cfDNA levels. (a,b) A negative correlation was detected between the percentage change of mean LINE-1 methylation vs. homocysteine and cfDNA level. (c) A positive correlation was noticed comparing cfDNA and homocysteine percentage change.

