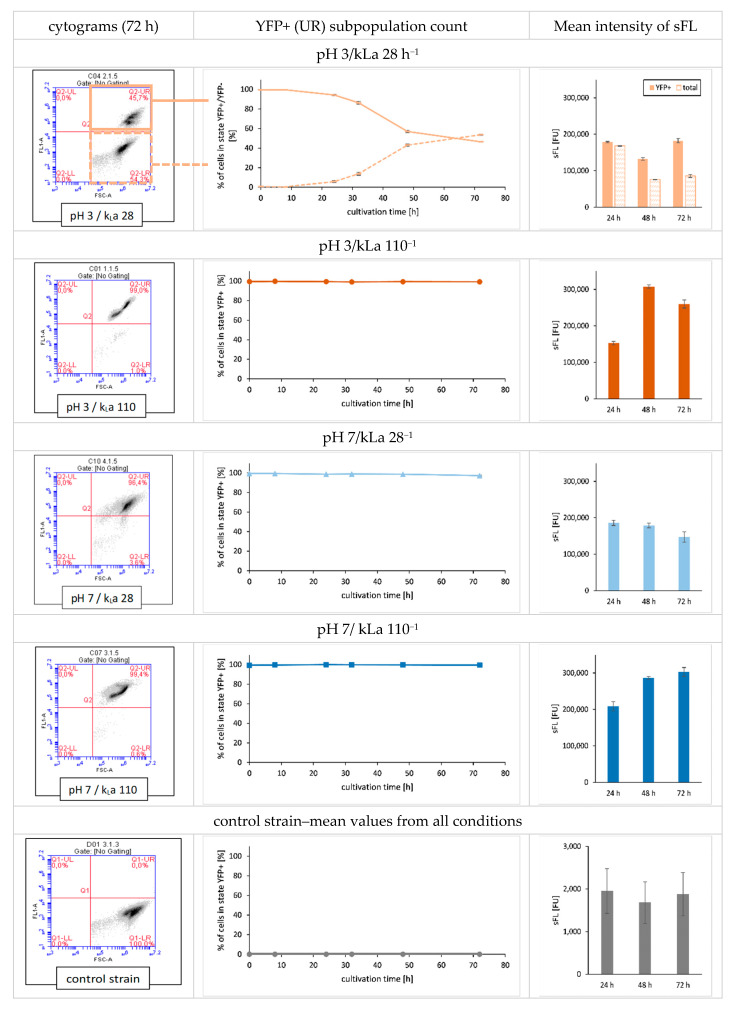
Figure 4.
Phenotypic analysis of Y. lipolytica LB strain populations cultured under specified conditions in terms of viability and intensity of intracellular FL. Cytograms (left panel) show the intensity of FL (y axis; FL-A channel) vs. morphology (x axis: FSC-A channel) at 72 h of culturing. Kinetic curves (middle panel) show percentage of metabolically active cells within the populations throughout the culturing time (y axis: %; x axis: time [h]). Histograms (right panel) show the mean value for intensity of FL in FU at indicated time-points. Cytograms are representative for biological triplicates. Curves and histograms show mean values of biological triplicate ±SD.

