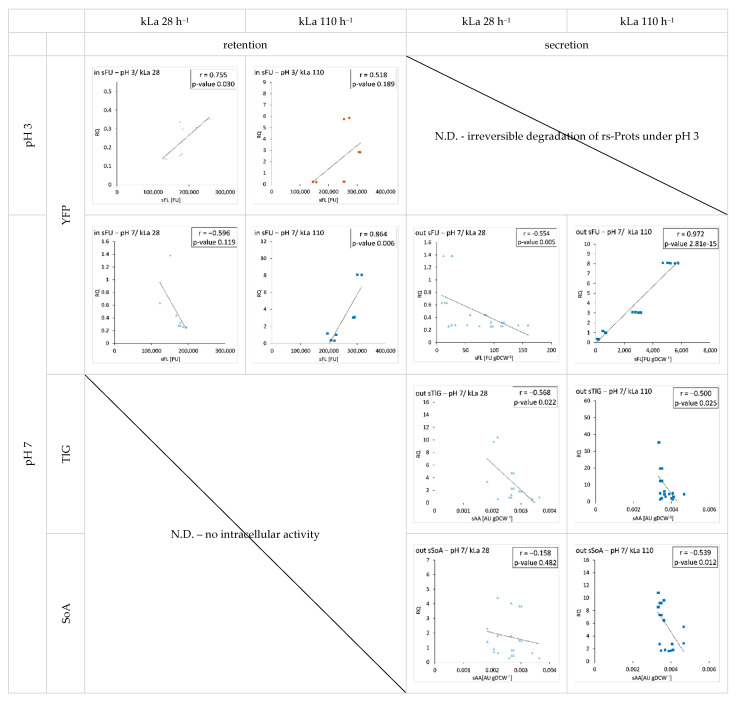
Figure 8.
Analysis of correlation between heterologous genes transcript level (y axis; RQ) and intracellular or extracellular FL or AA (x axis; sFL, sAA) of Y. lipolytica LB and HB strains cultured under specified conditions. Culturing conditions are given in the headings of columns and rows, and as sub-figures headings. r values denote Pearson correlation coefficients. N.D.—not determined due to indicated reasons.

