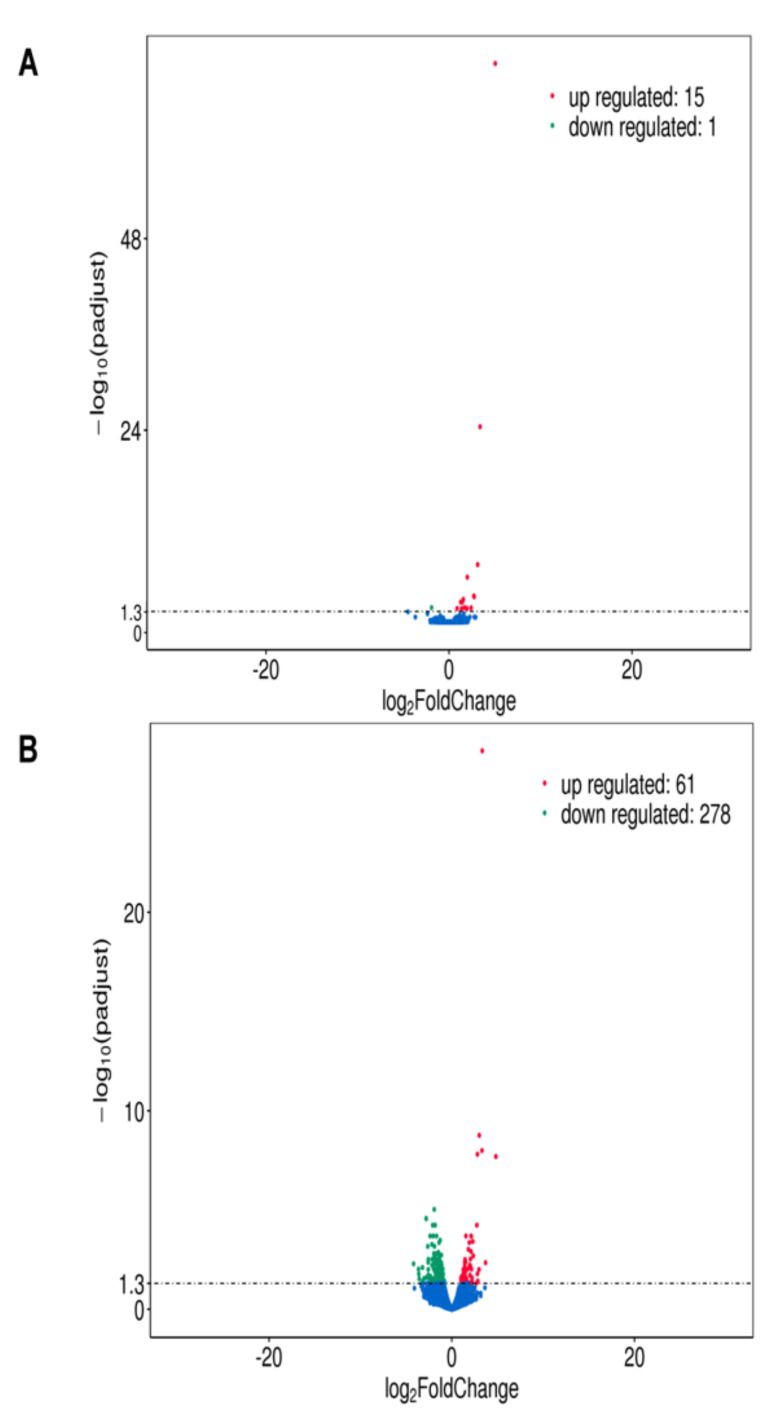
Figure 1.
Differential expression analysis of TM stimulated SCC-25 cells compared to the non-stimulated negative control. The input data for differential gene expression analysis are read counts from gene expression level analysis. The differential gene expression analysis contains read counts normalization, model-dependent p-value estimation, and FDR value estimation based on multiple hypothesis testing. The results are shown as volcano plots; the changes are indicated as log2fold change, padjust is the normalized p-value. NC = non-stimulated cells = negative control, TM = TM stimulated cells: (A) stimulation for 4 h, red dots: upregulated genes (15), blue dots: downregulated genes (1); (B) stimulation for 24 h red dots: upregulated genes (61), blue dots: downregulated genes (278).

