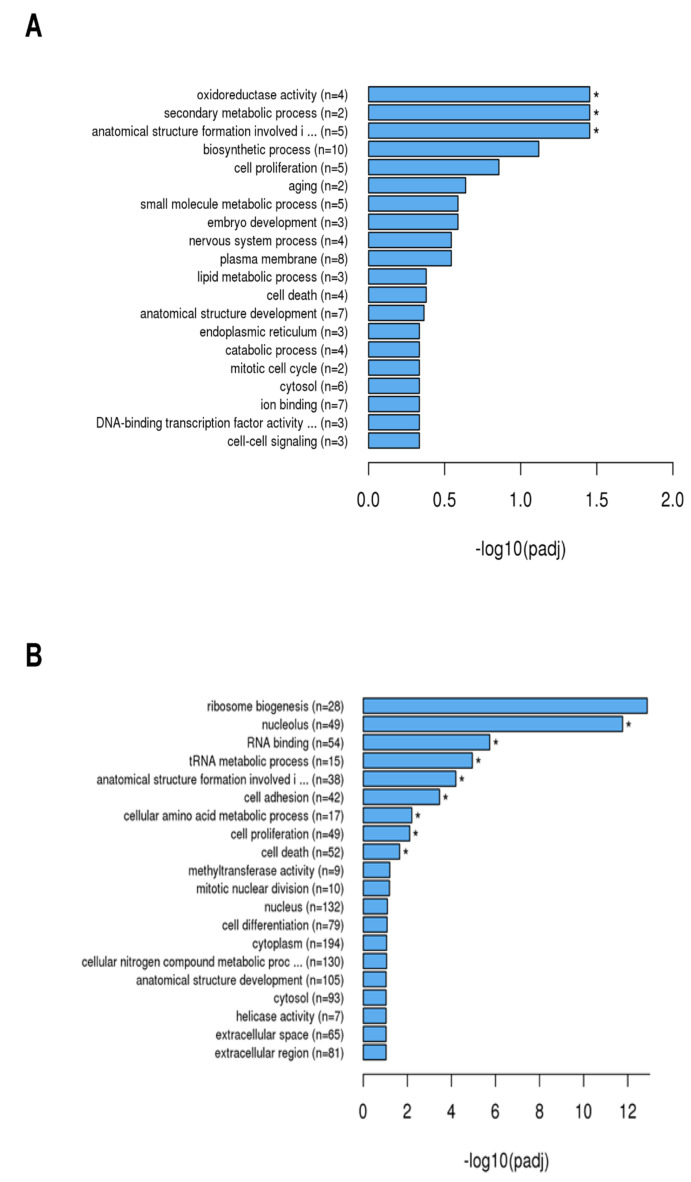
Figure 3.
Enrichment analysis using Gene Ontology (GO) of the differential expressed genes by SCC-25 cells was performed to find out which biological functions or pathways are significantly associated with differentially expressed genes. The noted gene expressions of biological processes, molecular functions, and cellular components are exhibited in a directed acyclic graph structure: (A) = 4 h stimulation with TM; (B) = 24 h stimulation with TM; padj = adjusted p-value. Generally, GO terms with corrected p-value shown as * < 0.05 (significant enrichment).

