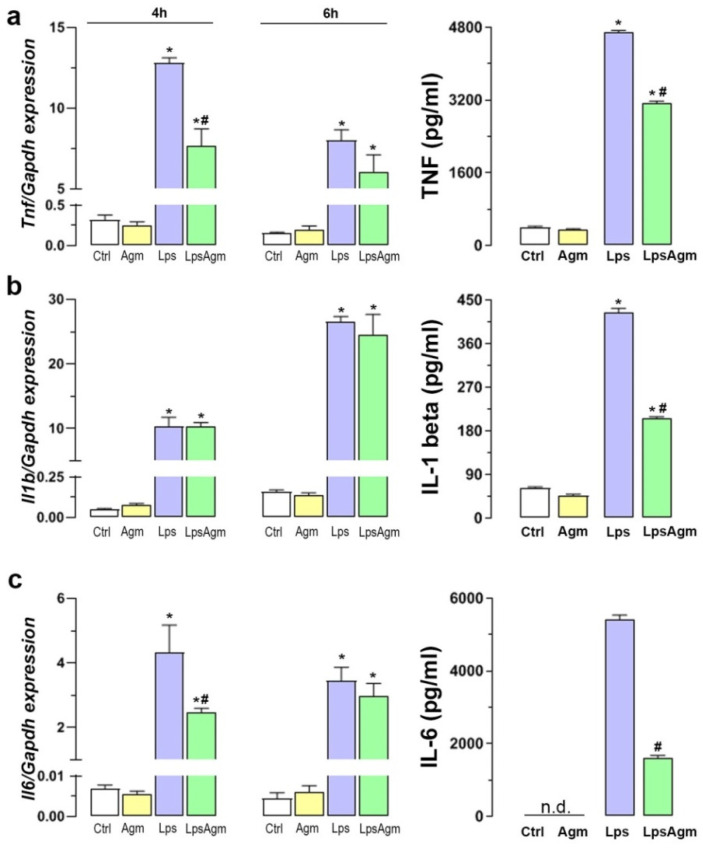
Figure 7.
Effect of Agm on proinflammatory cytokines gene expression and release by BV-2 cells. Schedule of Lps stimulation: 4 and 6 h for qPCR analysis; 24 h for TNF, IL-1 beta, and IL-6 protein levels measured in cell supernatants by ELISA. (a–c) Gene expression and protein levels of TNF (a), IL-1 beta (b), and IL-6 (c) Data are presented as mean ± SEM from three separate determinations. Results were analyzed by two-way ANOVA followed by Bonferroni’s post hoc tests, except IL-6 secretion, which was analyzed by Mann–Whitney test for comparing the mean values between two groups (Lps vs. LpsAgm) because Ctrl and Agm groups were not detectable (labeled n.d. on (c)). Significance levels shown inside the graphs: * p < 0.05 compared with the control group; # compared with Lps group.

