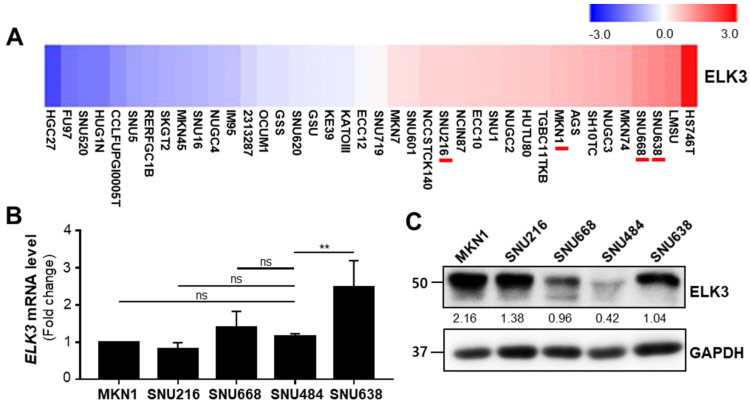
Figure 1.
ETS transcription factor ELK3 (ELK3) expression pattern in various gastric cancer cell lines. (A) ELK3 expression in gastric cancer cell lines from the Cancer Dependency Map (DepMap) database. (B) ELK3 mRNA expression in five gastric cancer cell lines, measured by reverse transcription-quantitative PCR. Error bars represent the standard deviation; ** p < 0.01 (one-way ANOVA). (C) ELK3 protein levels in five gastric cancer cell lines. The values indicate the signal intensities of ELK3 relative to GAPDH.

