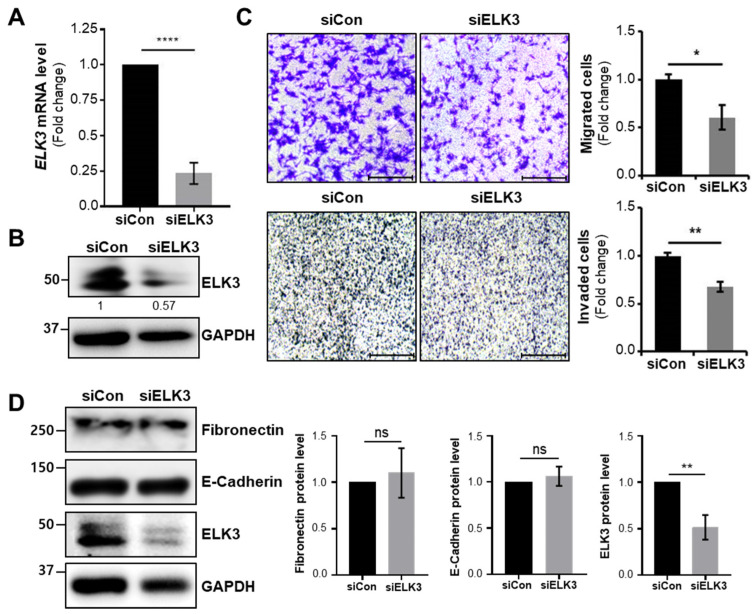
Figure 3.
Depletion of ELK3 decreases the migration and invasion of SNU638 cell line in E-cadherin independent manner. (A) ELK3 mRNA levels in SNU638 cells transfected with siCon or siELK3. Error bars represent the standard deviation; **** p < 0.0001 (student’s t-test). (B) ELK3 protein levels in SNU638 cells transfected with siCon or siELK3. The values indicate the signal intensities of ELK3 relative to GAPDH. (C) Representative images showing cell migration (top two panels) and cell invasion (bottom two panels) of SNU638 cells transfected with siCon or siELK3. Scale bar, 200 μm. Bar graphs indicate the number of migrated and invaded cells, respectively. Error bars represent the standard deviation; * p < 0.05 and ** p < 0.01 (student’s t-test). (D) Epithelial marker (E-cadherin), mesenchymal marker (Fibronectin), and ELK3 protein expression in SNU638 cells transfected with siCon or siELK3. Bar graphs indicate the quantified levels of each protein, in relative scales. Error bars represent the standard deviation; ** p < 0.01 (student’s t-test). ELK3, ETS transcription factor ELK3; si, small interfering RNA; Con, control.

