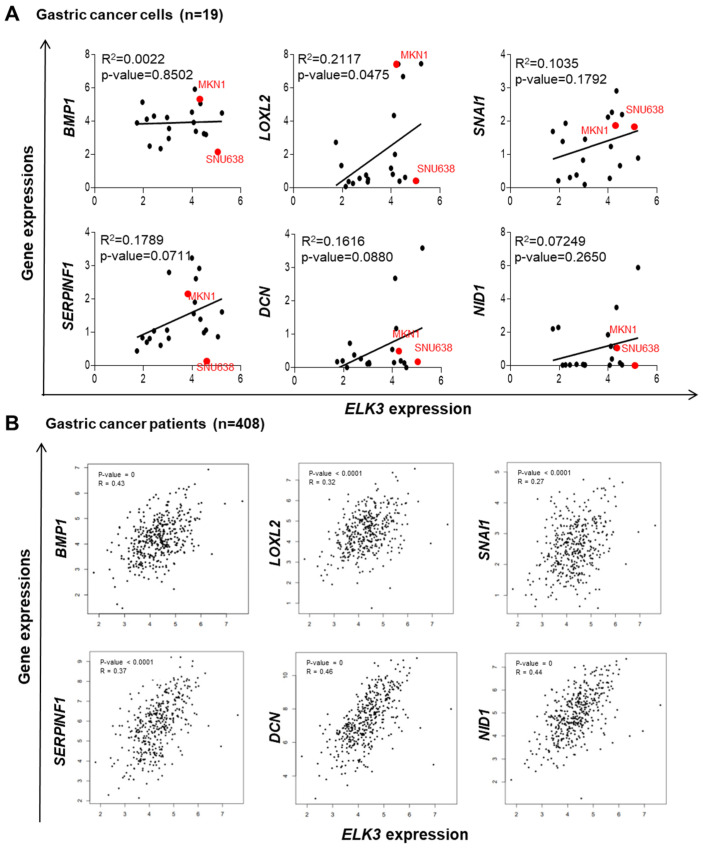
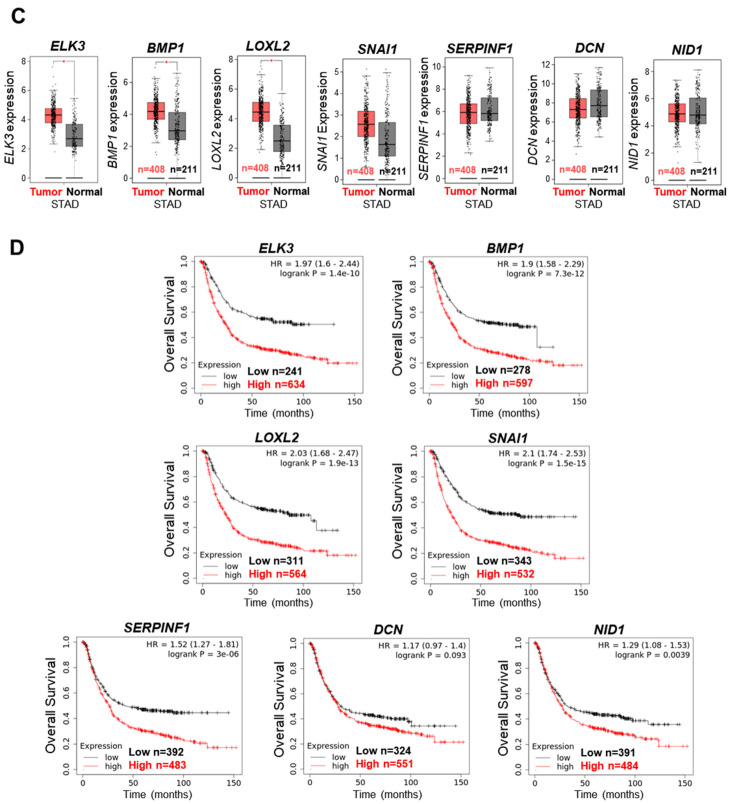
Figure 7.
ELK3 positively regulates ECM remodeling-related genes in gastric cancer cells and patient tissues. (A) Dot plots illustrating the correlation between ELK3 and the indicated genes. Each dot denotes a single cell line. Red dots denote SNU638 and MKN1 cells used in the present study. All cell lines expression data were obtained from the Cancer Dependency Map database. p < 0.05 was considered to indicate a statistically significant difference. (B) Correlation plot illustrating the link between ELK3 and the indicated genes in patients with gastric cancer. Each dot denotes a single patient. p < 0.05 was considered to indicate a statistically significant difference. (C) Box plots illustrating the expression of the indicated genes in samples from patients with gastric cancer (n = 408) and healthy samples (n = 211). p < 0.05 was considered to indicate a statistically significant difference. (D) Kaplan-Meier survival plots showing the overall survival of patients with gastric cancer with high or low expression of the indicated genes. All patient data were obtained from the Cancer Genome Atlas. p < 0.05 was considered to indicate a statistically significant difference. STAD, stomach adenocarcinoma.


