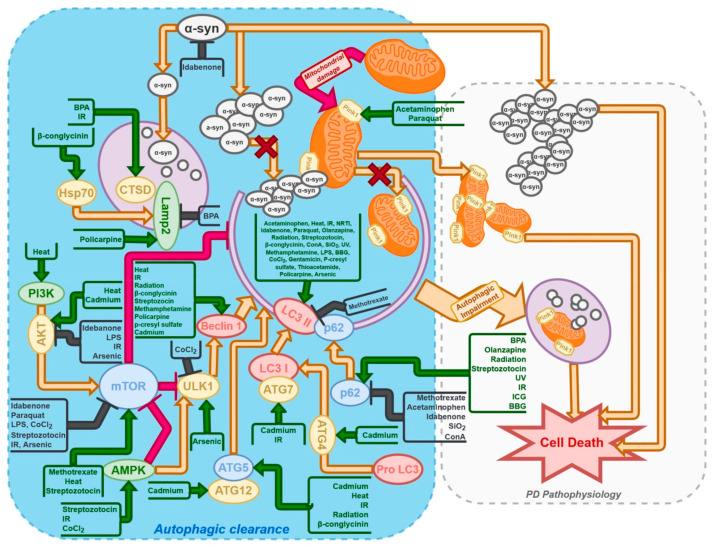
Figure 1.
Diagram presenting modulation of the autophagy pathway in mammalian nerve cells induced by factors used to establish a research PD model. The green arrows indicate induction of mRNA/protein expression, whereas the red arrows indicate an inhibitory effect of the presented compounds. Additionally, the protein–protein interactions are shown, in which the yellow arrows indicate induction of mRNA/protein expression, whereas the black arrows indicate an inhibitory effect.

