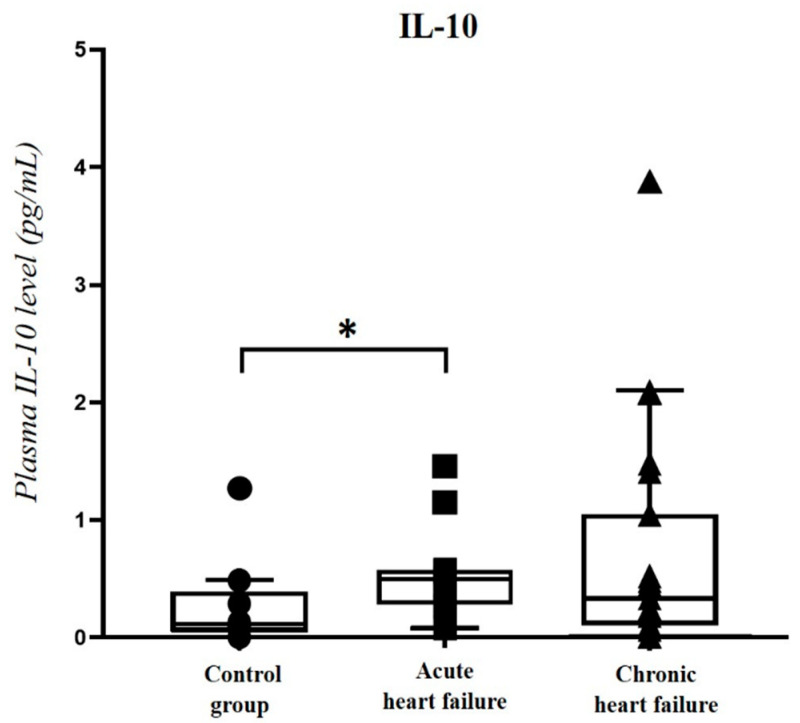
Figure 5.
IL-10 levels in acute (n = 12) and chronic heart failure (n = 19) patients and in the control group (n = 9). The box plot diagram represents the interquartile range, median values and the outliers. The individual values are presented with black dots (control group), squares (acute HF) or triangles (chronic HF). Statistical analysis was performed with one-way ANOVA test with Tukey post-hoc test. * p < 0.05 vs. control group.

