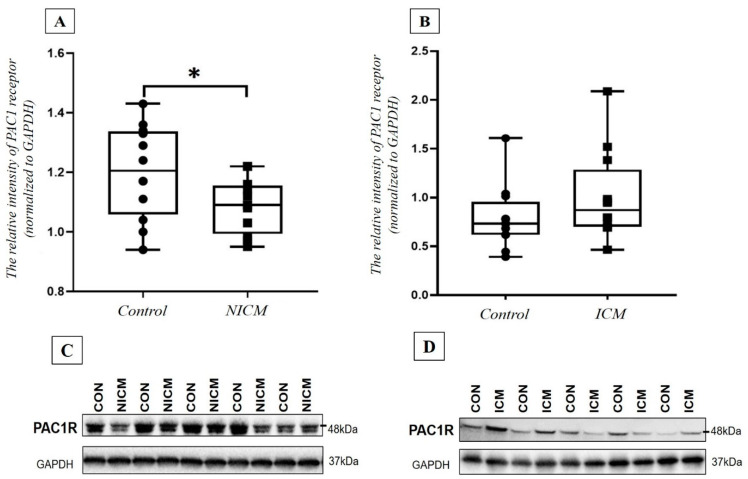
Figure 7.
PAC1 receptor relative intensity in non-ischemic cardiomyopathy (A) (NICM, n = 11) and ischemic cardiomyopathy (B) (NICM, n = 11; ICM, n = 12) vs. control group (CON, n = 12). (C,D) pictures show the scanned Western blot representative images. PAC1 receptor values are normalized to GAPDH. The box plot diagram represents the interquartile range and median values. The individual values are presented with black dots (control group) or squares (NICM or ICM). Statistical analysis was performed with Mann–Whitney test. * p < 0.05 vs. control group.

