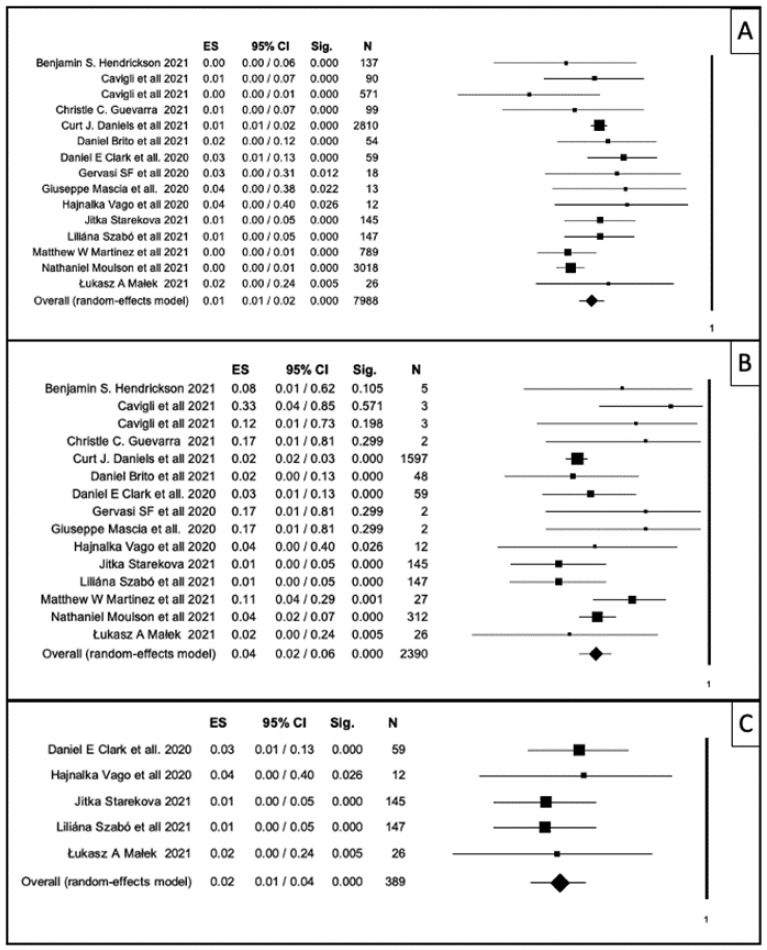
Figure 2.
Forest plot: horizontal axis represents 95% confidence interval; rhombuses and squares represent the weight of the study in relation to the total. (A) Forest plot showing myocarditis event rate in the total sample of athletes (n = 7988) who recovered from COVID-19 infection. (B) Forest plot showing myocarditis event rate only in the subgroup of athletes (n = 2390) who were studied with CMR. (C) Forest plot showing myocarditis rate in studies in which all athletes who recovered from COVID-19 were studied with CMR. This subgroup included 389 athletes.

