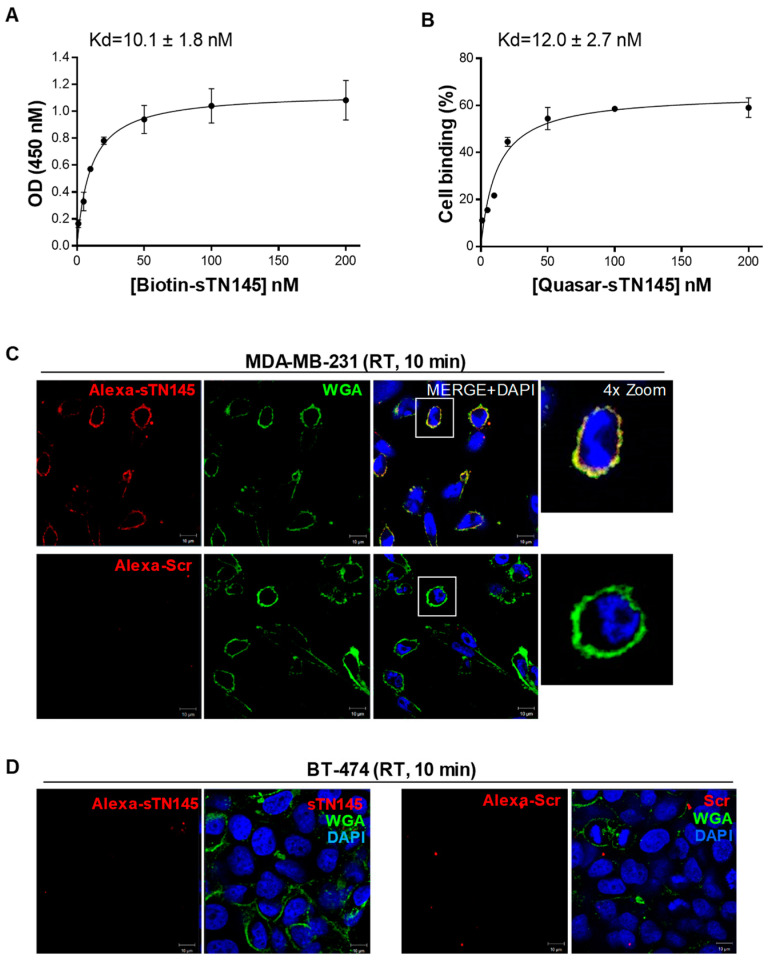
Figure 2.
Cell binding of the sTN145 aptamer. Binding curves of sTN145, 5′-biotinylated (A) or 5′-Quasar 670-labeled (B) on MDA-MB-231 cells for calculation of the apparent Kd of aptamer-cell interaction. Binding was analyzed using streptavidin-biotin-based (A) or flow cytometric (B) assays. Data shown are mean ± SD of three independent experiments. (C,D) Representative confocal images of MDA-MB-231 (C) and BT-474 (D) cells incubated for 10 min at RT with Alexa 647-labeled sTN145 or Scr. After washing and fixation, cells were labeled with WGA-488 (green) to visualize the cell membrane and with DAPI (blue) to stain nuclei. Alexa 647-labeled aptamers are displayed in red. All digital images were captured at the same setting to allow direct comparison of staining patterns. Magnification 63×, 1.0× digital zoom, scale bar = 10 μm. At least three independent experiments were performed. In (C), co-localization results appear yellow in the merged images. Inset: 4× digital zoom.

