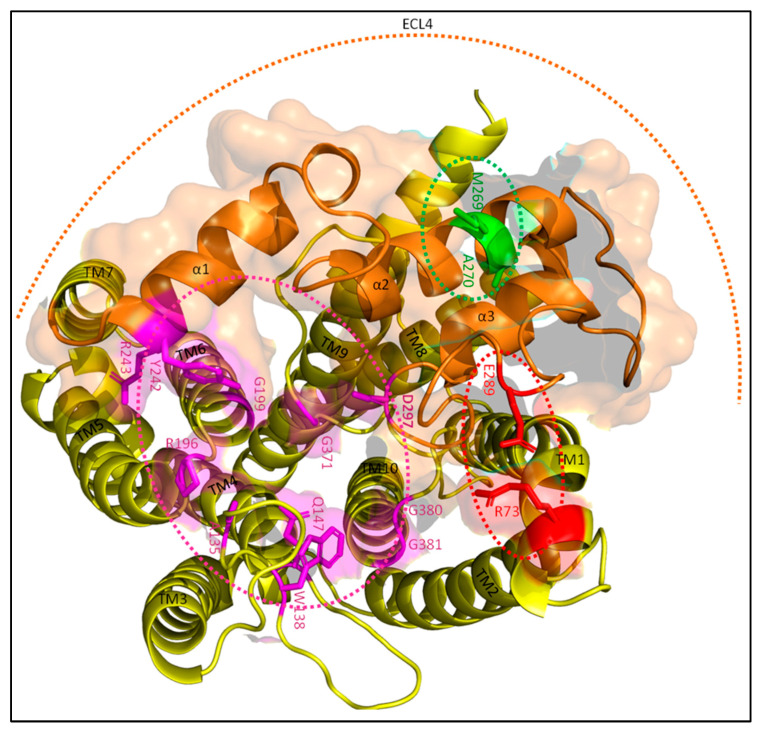
Figure 4.
FtsW active site. A single FtsW protein (yellow) is shown from above in the periplasm. The active site is indicated by the magenta–dotted ellipse with active site residues also highlighted in magenta. The ECL4 (orange) contains the putative catalytic residue D297, a region around M269 (green) that activates FtsW, and another region around E289 (red) that inhibits FtsW. E289 forms a putative interaction with R73 in this prediction. α1, α2 and α3 indicate the three α-helixes of ECL4. The FtsI interaction interface is highlighted in transparent orange. The active site residues are from the paper of Li et al. [67].

