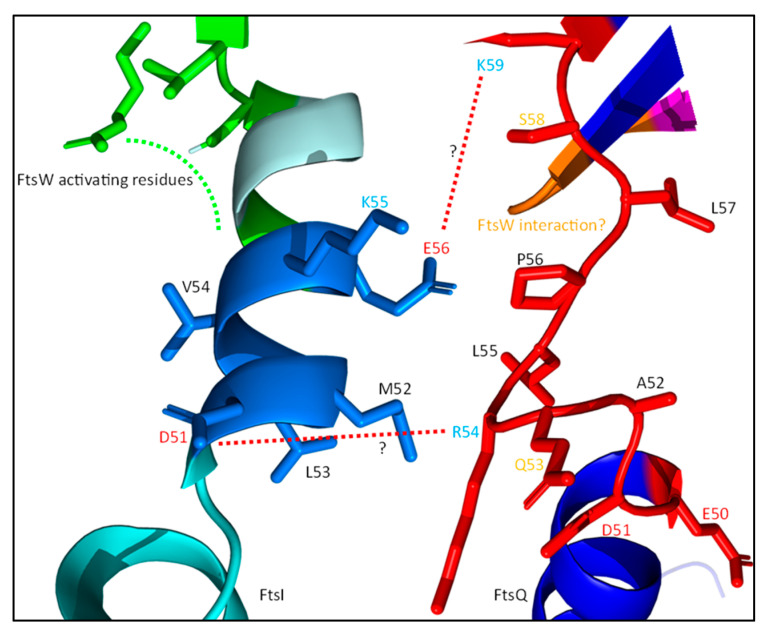
Figure 14.
Potential FtsQ–FtsI interactions. The potential FtsQ–FtsI interaction interface described in Table 2 is shown here in the predicted structures of FtsI and FtsQ. The FtsI region forms a helix, while the FtsQ region is an unstructured loop. Possible regulating interactions have been indicated with the red lines and the FtsW-activating residues of FtsI in green.

