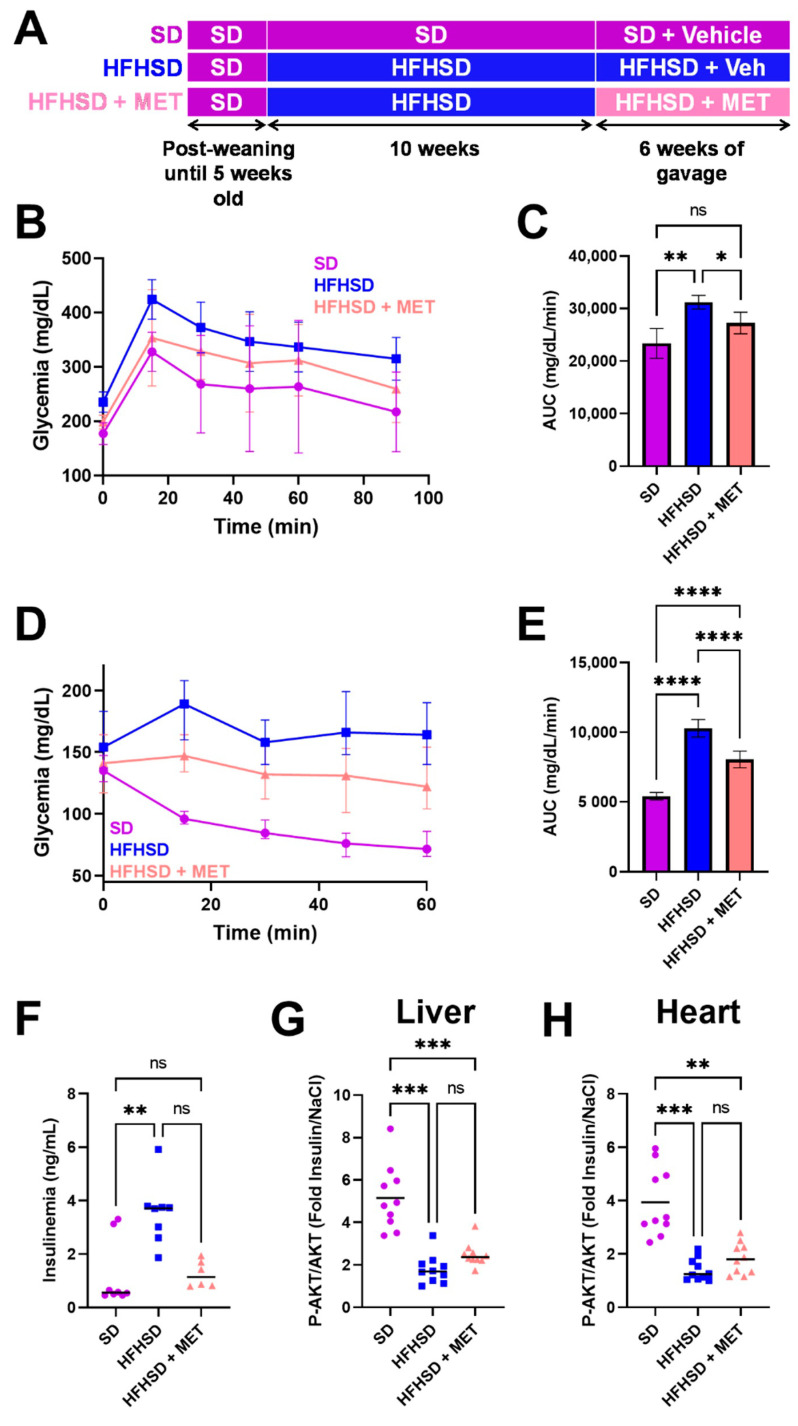
Figure 1.
Evaluation of metformin effects on the metabolic status of the HFHSD mice. (A) Timeline of the experimental protocol. Daily oral gavage consisted on either metformin (200 mg/kg, HFHSD + MET) or the vehicle (0.5% methylcellulose). Measurements of glycemia following a glucose (B) or insulin (D) tolerance test, and respective quantification of the area under curve (AUC) in (C,E) (n = 5 mice/group for GTT and 14–15 mice/group for ITT). Mean ± SD, Brown–Forsythe, and Welch ANOVA test. (F) Quantification of blood insulin level. (G,H) Analysis of insulin sensitivity in liver (G) and heart (H) by quantification of the cardiac phosphorylation of AKT (on Ser473), calculated as a fold increase of insulin-induced AKT phosphorylation over NaCl (n = 10 mice/group). Mean, Brown–Forsythe, and Welch ANOVA test. * p < 0.05, ** p < 0.005, *** p < 0.001, **** p < 0.0001. ns = non-significant. Symbols: circle: SD, square: HFHSD, triangle: HFHSD + MET.

