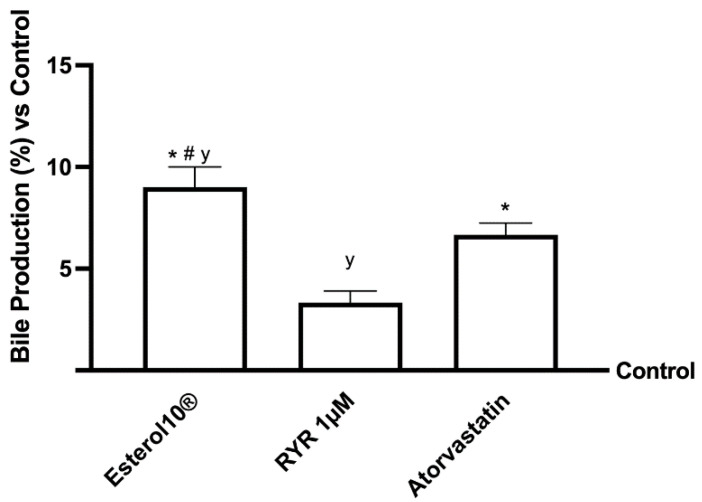
Figure 4.
Bile acid production following treatment of hepatic in vitro model. The abbreviations are the same as reported in Figure 1. Data are mean ± SD of five independent experiments performed in triplicate. * p < 0.05 vs. control; # p <0.05 vs. RYR and y p < 0.05 vs. Atorvastatin.

