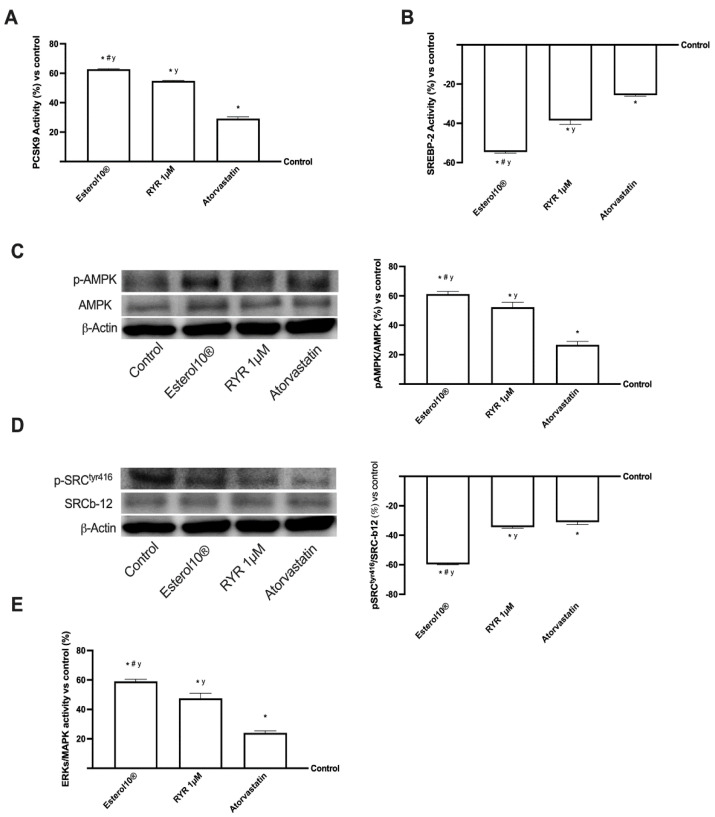
Figure 5.
Intracellular pathways activated in HepG2 cells. In (A,B,E) the protein activity of PCSK9, SRC, and ERK was measured by an ELISA test; in (C,D) the analysis of AMPK and SRC performed by Western Blot and densitometric analysis. The abbreviations are the same reported in Figure 1. Data are mean ± SD of five independent experiments performed in triplicates. The images reported are an example of a Western blot obtained with technical replicates. * p < 0.05 vs. control; # p < 0.05 vs. RYR; y p < 0.05 vs. Atorvastatin.

