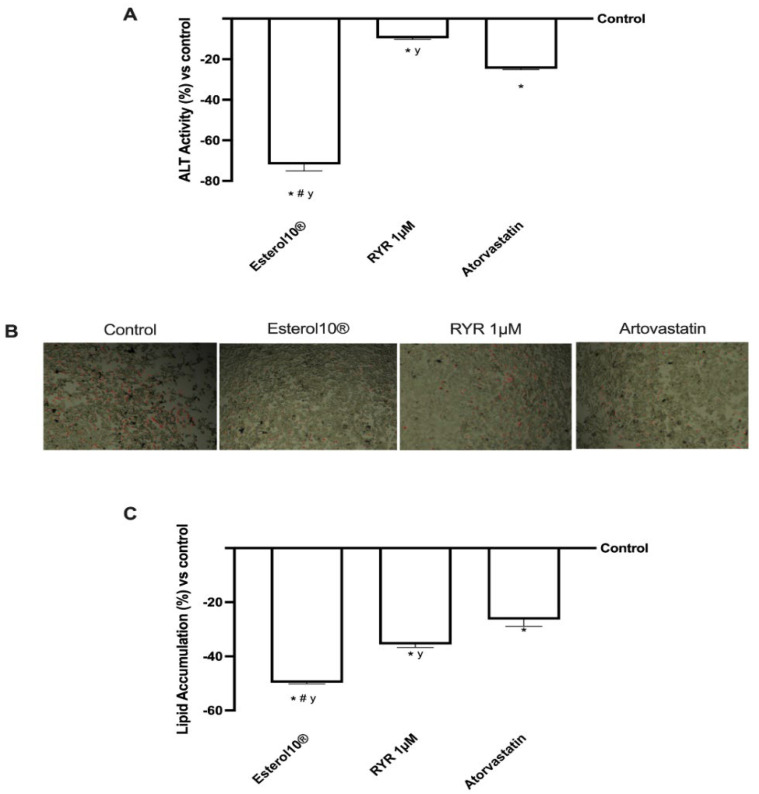
Figure 6.
Tissue integrity analysis. In (A), ALT activity was measured by an ELISA test. Images captured under the microscope at an original magnification of ×20 and reported in (B) showed the intercellular oil droplets stained by the Oil Red stain. These oil droplets are solubilized for quantification by spectrophotometric analysis reported in (C). The abbreviations are the same as shown in Figure 1. Data are mean ± SD of five independent experiments performed in triplicate. * p < 0.05 compared to the control; # p <0.05 vs. RYR; y p <0.05 vs. Atorvastatin.

