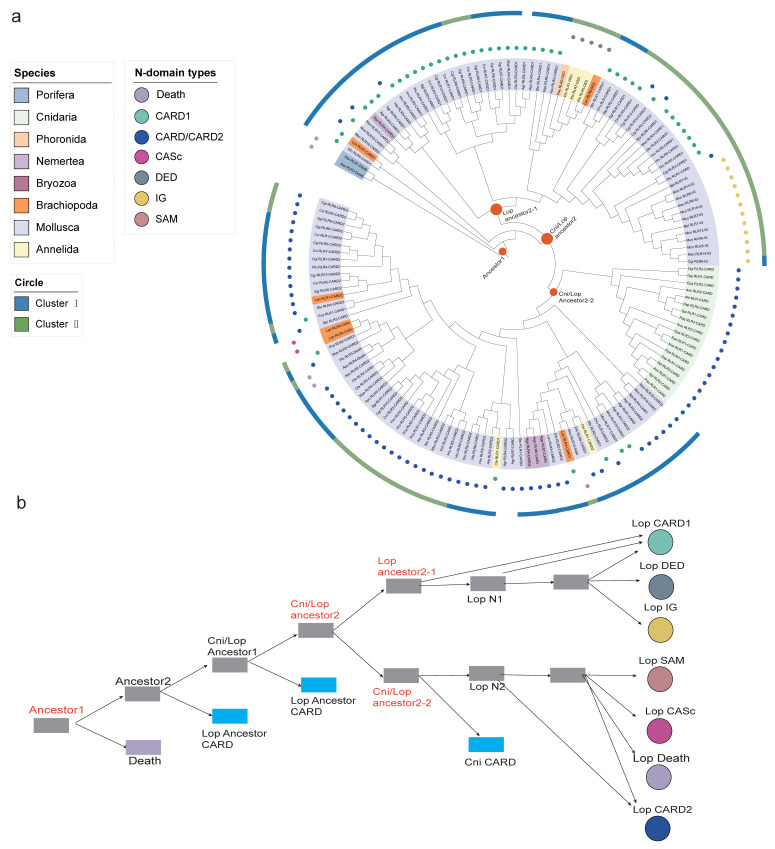
Figure 5.
The evolution of N-terminal domains (CARD, DED, IG, death, CASc, SAM) of lophotrochozoan RLRs. (a) Phylogenetic tree constructed with the maximum likelihood method showing the evolution of N-terminal domains of RLRs in lophotrochozoans. The different background colors of the gene names represent the phyla to which they belong, as shown in the legend ‘Species’. The different colored circles represent different domains, as shown in the legend ‘Domain’. The blue arc in the outermost circle represents Cluster I, and the green arc represents Cluster II. The orange circles on the branches marked on the tree correspond to the important nodes in (b). (b) A schematic diagram of the evolution of the N-terminal domains of RLRs in lophotrochozoans based on the phylogenetic tree. Cni stands for Cnidaria, and Lop stands for the lophotrochozoan. Ancestor1 indicates an ancestor where a duplication produced the first N-terminal death domain and a common ancestor of all other N-terminal domains. Cni/Lop ancestor2 indicates an ancestor where a duplication occurred that produced different N-terminal domains. Lop N1 represents the first domain of the N-terminal RLR, and Lop N2 represents the second. Solid black lines indicate duplication events. Colors of N-terminal domains correspond to color labels in the trees in (a).

